Submit an Article
Navigate
Home
Editorial Board
Editorial Policies
Current Volume
Archive
Scientific Integrity
Publication Ethics Statements
Interviews with Outstanding Authors
Newsroom
Sponsored Conferences
Podcast
Contact
Special Collections
Submit an Article
Online ISSN: 1945-4589
Research Paper
|
Volume 13, Issue 4
|
pp. 5332–5341
A novel risk model to predict first-ever ischemic stroke in heart failure with reduced ejection fraction
Back to article
Figure 3
(3 of 4)
−
100%
+
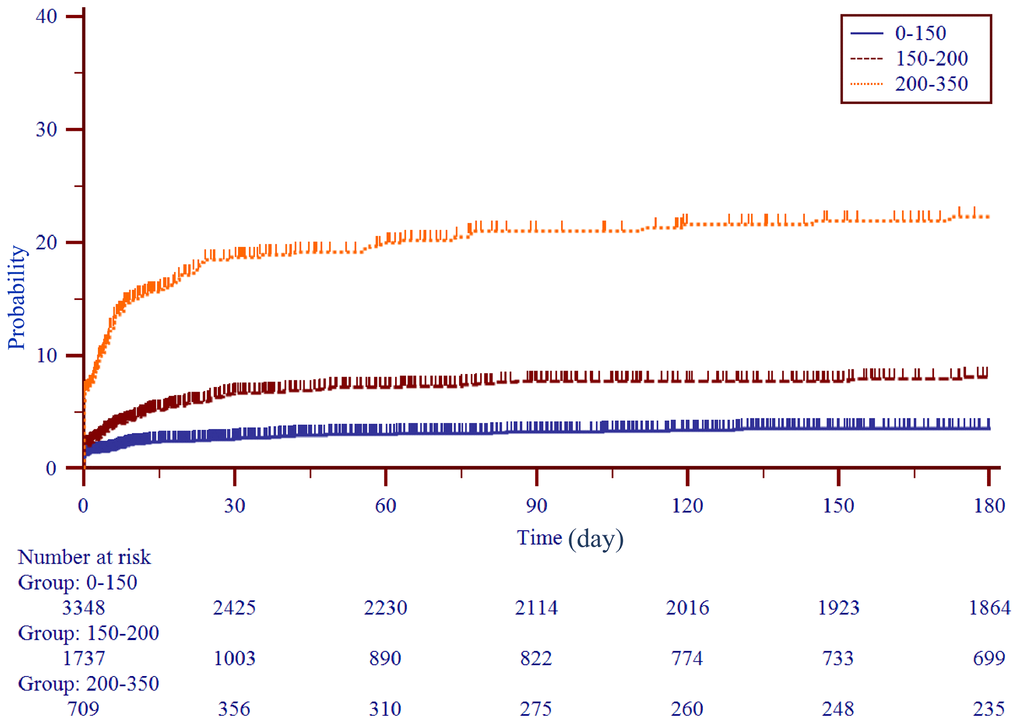
Figure 3.
Kaplan-Meier curves stratified by three subgroups by score levels (0-150, 150-200, 200-350).
Figure 3 — A novel risk model to predict first-ever ischemic stroke in heart failure with reduced ejection fraction | Aging