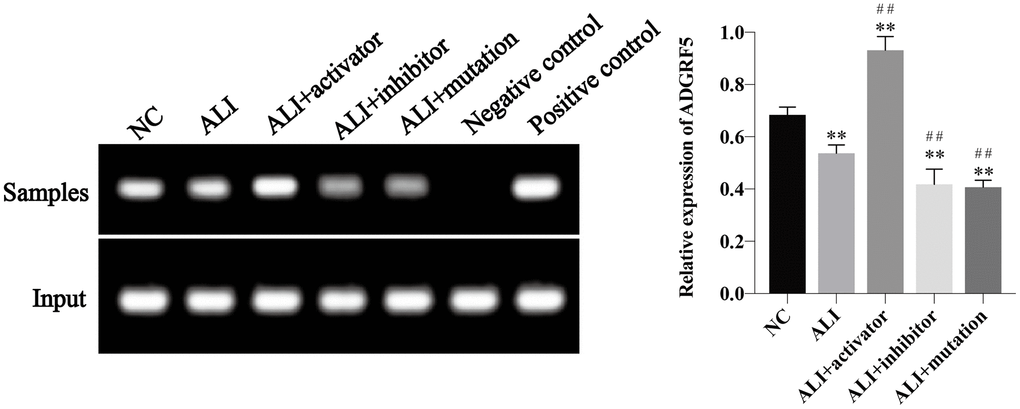
Figure 5.The binding of E2F3 and ADGRF5 was demonstrated using CHIP analysis and the relative expression of ADGRF5 was calculated via normalized to the input group. *P<0.05 vs NC group, **P<0.01 vs NC group, #P<0.05 vs ALI group, ##P<0.01 vs ALI group.