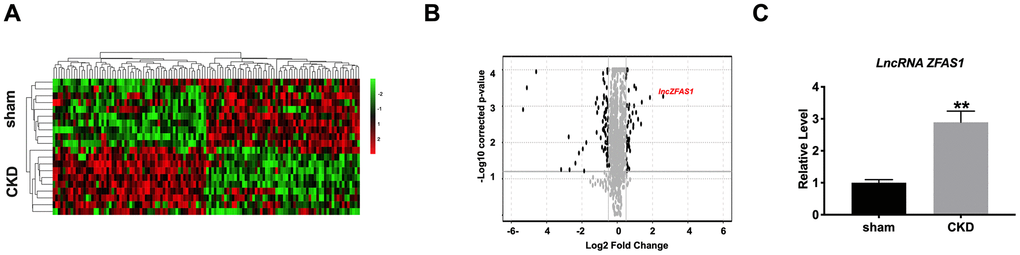
Figure 1.Increased level of lncRNA ZFAS1 in the heart tissue of CKD mice. (A) The volcano plot of lncRNAs. (B) Heat map of microarray data was used to show the significant expression of lncRNAs in heart tissues of sham and CKD mice. (C) The expression of lncRNA ZFAS1 was detected in the heart tissues of sham and CKD mice. *P<0.05.