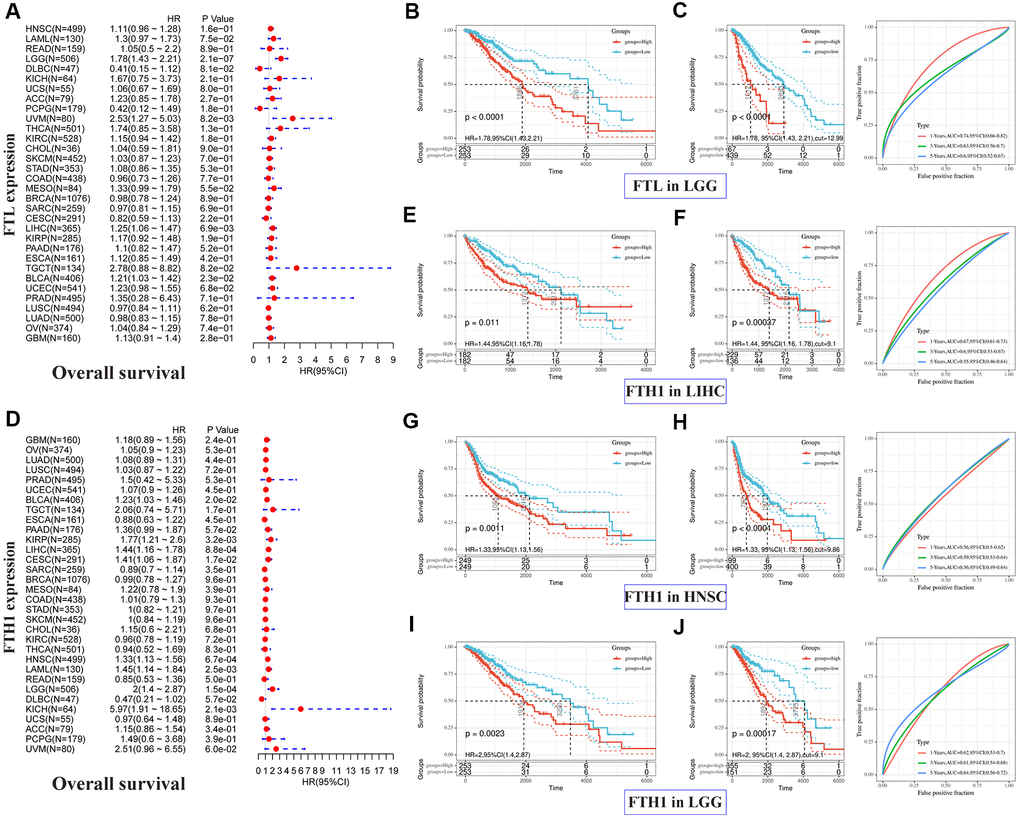
Figure 2.Positive correlations between high FTL and FTH1 expressions and poor OS in several tumors. (A) Univariate analysis showed the positive association between high FTL level and poor OS in patients with LGG (P = 2.1 × 10⁻⁷), UVM (P = 8.2 × 10⁻³), LIHC (6.9 × 10⁻³), BLCA (P = 2.3 × 10⁻²). (B, C) High FTL mRNA level was related to poor OS in LGG (HR 1.78, 95% CI 1.43–2.21, P < 0.0001). (D) Univariate analysis showed the positive association between high FTH1 level and poor OS in patients with BLCA (P = 0.2 × 10⁻¹), KIRP (P = 3.2 × 10⁻³), LIHC (P = 8.8 × 10⁻⁴), CESC (P = 1.7 × 10⁻²), HNSC (P = 6.7 × 10⁻⁴), LAML (P = 2.5 × 10⁻³), LGG (P = 1.5 × 10⁻⁴), KICH (P = 2.1 × 10⁻³). (E–J) High FTH1 mRNA level was related to poor OS in LIHC (HR 1.44, 95% CI 1.16–1.78, P = 1.1 × 10⁻²), HNSC (HR 1.33, 95% CI 1.13–1.56, P = 1.1 × 10⁻³), LGG (HR 2, 95% CI 1.4–2.87, P = 2.3 × 10⁻³). Only the tumors with P < 0.001 in univariate analysis will do the further Kaplan–Meier and ROC analysis.