


Introduction
Ferritin, the most important iron storage form in humans, is an essential nutrient that plays crucial roles in diverse cellular physiopathological processes, including regulation of the tumor microenvironment and immunometabolism [1, 2]. Ferritin is composed of two subunits: a light chain (FTL, 19 kDa) and a heavy chain (FTH, 21 kDa) [3]. We previously showed that FTH1 and FTL have positive linear correlation and the protein expression levels of both were higher in head and neck squamous cell carcinoma (HNSC) tumor tissues compared with normal tissues, and that elevated FTH1 was related to poorer prognosis [4].
Increasing evidence supports a role for iron metabolism in supporting immunity to various cancers [1, 5, 6]. Increases in intracellular iron initially promote T and B cell proliferation, but excessive iron levels ultimately induce oxidative stress-related cell death [7]. Reducing the iron content of the tumor microenvironment has been shown to improve the anti-tumor immune response in breast cancer [8], suggesting that iron chelation therapy in combination with conventional treatment modalities may be a promising strategy for cancer therapy [9]. However, the role played by ferritin in regulating the tumor microenvironment is unclear, and little is known about whether or how FTL and FTH1 expression levels might correlate with tumor infiltration by diverse immune cell subsets. The Pan-Cancer Atlas, which is an essential resource for the development of precision medicine, seeks to reclassify cancers on the basis of their molecular similarities rather than their cellular origins. Along these lines, a comprehensive analysis of correlations between ferritin subunit levels and immune components in solid tumors could provide us with a better understanding of how iron metabolism influences tumor immunity.
In the present study, we analyzed the expressions of FTL and FTH1 in various cancer RNA-sequencing datasets, and we performed a comprehensive analysis of correlations between FTL and FTH1 levels and tumor-infiltrating immune cells, with the goal of uncovering a potential role for FTL and FTH1 in tumor immunology. To this end, we analyzed datasets from The Cancer Genome Atlas (TCGA), a landmark cancer genomics database started in 2006 [10–12], and additionally employed a number of bioinformatics tools to assess the relationship between tumor FTL and FTH1 levels and tumor infiltration by various immune cell subsets. These tools included Estimation of Stromal and Immune cells in Malignant Tumor tissues using Expression data (Estimate) [13], Microenvironment Cell Population (MCP)-counter [14], Tumor Immune Estimation Resource (TIMER), [15] and Tumor-Immune Miner (TIMINER) [16].
Results
FTL and FTH1 are upregulated and downregulated, respectively, in most human cancers assessed
To determine whether FTL and FTH1 are differentially expressed in human cancers, we examined expression datasets from TCGA and GTEx databases. The results showed that FTL was upregulated in 21 of the 27 cancers analyzed (77.8%), downregulated in three cancers (11.1%; CHOL, LAML, LUSC), and not significantly changed in three cancers (11.1%; BLCA, KICH, KIRP) compared with normal tissues (Figure 1A). Conversely, FTH1 was downregulated in 22 of the 27 cancers (81.5%), upregulated in four cancers (14.8%; CHOL, HNSC, KIRC, KIRP), and unchanged in only one cancer (3.7%; UCEC) (Figure 1B).
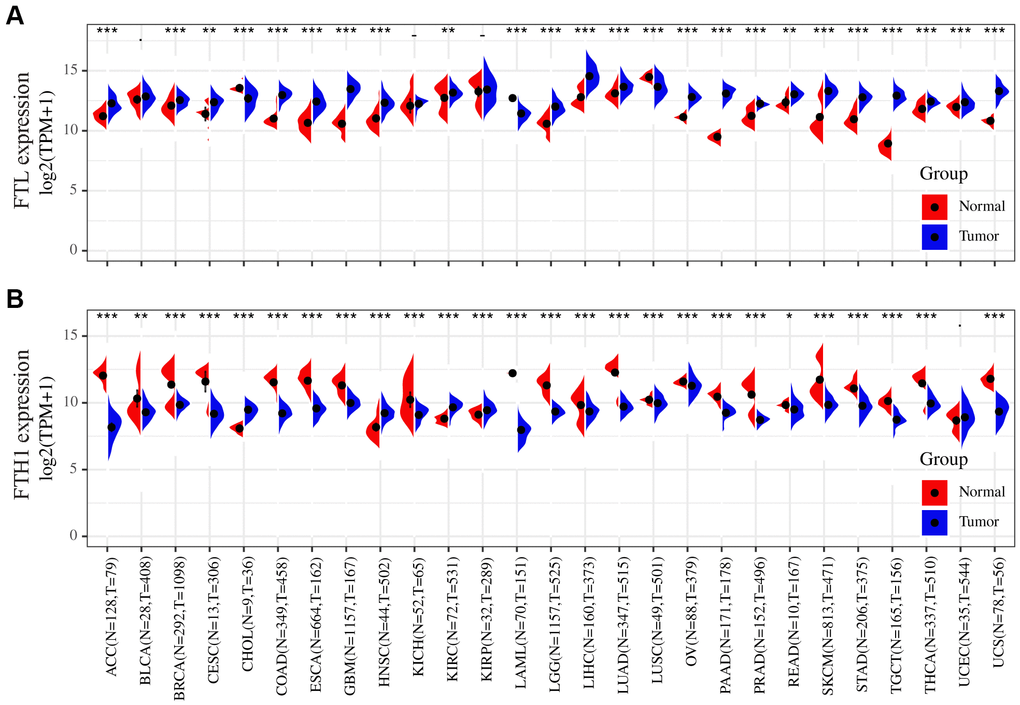
Figure 1. Differences in the FTL and FTH1 expressions between 27 tumors and corresponding normal tissues. (A) FTL level was up-regulated in tumors of ACC, BRCA, CESC, COAD, ESCA, GBM, HNSC, KIRC, LGG, LIHC, LUAD, OV, PAAD, PRAD, READ, SKCM, STAD, TGCT, THCA, UCEC, UCS, down-regulated of CHOL, LAML, LUSC. (B) FTH1 level was up-regulated in tumors of CHOL, HNSC, KIRC, KIRP, down-regulated of ACC, BRCA, BLCA, CESC, COAD, ESCA, GBM, KICH, LAML, LUSC, LGG, LIHC, LUAD, OV, PAAD, PRAD, READ, SKCM, STAD, TGCT, THCA, UCS. Datasets were from TCGA and GTEx. - not significant, * P < 0.05, ** P <0.01, *** P < 0.001.
FTL and FTH1 levels are positively associated with poor prognosis in many human cancers
Correlations between FTL and FTH1 levels and patient prognosis were first examined separately by univariate survival analysis. FTL expression was significantly associated with OS in 4 cancer types (Figure 2A): LGG (hazard ratio [HR] 1.78, 95% confidence interval [CI] 1.43–2.21, P = 2.1 × 10⁻⁷), UVM (HR 2.53, 95% CI 1.27–5.03, P = 8.2 × 10⁻³), LIHC (HR 1.25, 95% CI 1.06–1.47, P = 6.9 × 10⁻³), and BLCA (HR 1.21, 95% CI 1.03–1.42, P = 2.3 × 10⁻²). FTH1 expression was significantly associated with OS in eight cancer types (Figure 2D): BLCA (HR 1.23, 95% CI 1.03–1.46, P = 0.2 × 10⁻¹), KIRP (HR 1.77, 95% CI 1.21–2.6, P = 3.2 × 10⁻³), LIHC (HR 1.44, 95% CI 1.16–1.78, P = 8.8 × 10⁻⁴), CESC (HR 1.41, 95% CI 1.06–1.87, P = 1.7 × 10⁻²), HNSC (HR 1.33, 95% CI 1.13–1.56, P = 6.7 × 10⁻⁴), LAML (HR 1.45, 95% CI 1.14–1.84, P = 2.5 × 10⁻³), LGG (HR 2, 95% CI 1.4–2.87, P = 1.5 × 10⁻⁴), and KICH (HR 5.97, 95% CI 1.91–18.65, P = 2.1 × 10⁻³). We then selected cancers in which FTL and FTH1 levels were associated with OS at P < 0.001, and performed Kaplan–Meier analysis of OS in patients stratified into high and low expression groups by ROC curve analysis. The results suggested that high FTL (Figure 2B, 2C) or high FTH1 (Figure 2E–2J) mRNA levels were each related to poor OS in several cancer types. Cox regression analysis further showed that FTL was an independent prognostic marker in LGG, UVM and LIHC (Supplementary Table 2).
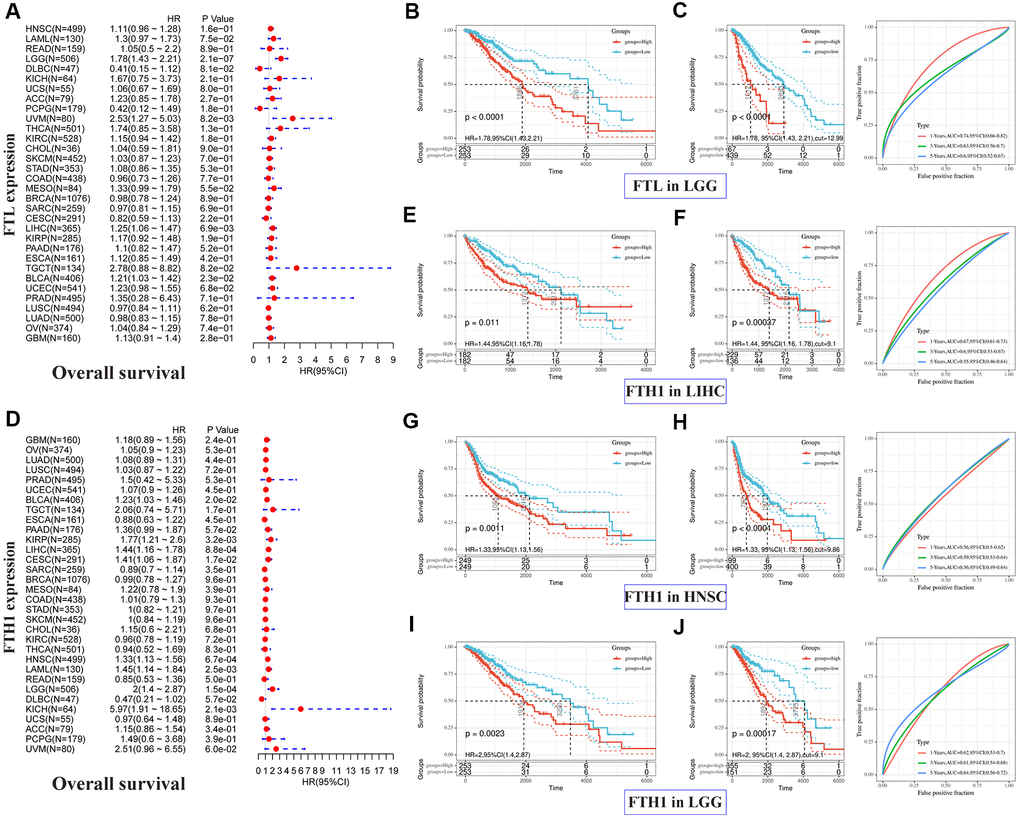
Figure 2. Positive correlations between high FTL and FTH1 expressions and poor OS in several tumors. (A) Univariate analysis showed the positive association between high FTL level and poor OS in patients with LGG (P = 2.1 × 10⁻⁷), UVM (P = 8.2 × 10⁻³), LIHC (6.9 × 10⁻³), BLCA (P = 2.3 × 10⁻²). (B, C) High FTL mRNA level was related to poor OS in LGG (HR 1.78, 95% CI 1.43–2.21, P < 0.0001). (D) Univariate analysis showed the positive association between high FTH1 level and poor OS in patients with BLCA (P = 0.2 × 10⁻¹), KIRP (P = 3.2 × 10⁻³), LIHC (P = 8.8 × 10⁻⁴), CESC (P = 1.7 × 10⁻²), HNSC (P = 6.7 × 10⁻⁴), LAML (P = 2.5 × 10⁻³), LGG (P = 1.5 × 10⁻⁴), KICH (P = 2.1 × 10⁻³). (E–J) High FTH1 mRNA level was related to poor OS in LIHC (HR 1.44, 95% CI 1.16–1.78, P = 1.1 × 10⁻²), HNSC (HR 1.33, 95% CI 1.13–1.56, P = 1.1 × 10⁻³), LGG (HR 2, 95% CI 1.4–2.87, P = 2.3 × 10⁻³). Only the tumors with P < 0.001 in univariate analysis will do the further Kaplan–Meier and ROC analysis.
Next, we performed the same analyses to examine correlations between FTL and FTH1 expressions and PFI and, not surprisingly, obtained results similar to the OS analysis. FTL expression was significantly associated with PFI in four cancer types (Figure 3A): LGG (HR 1.5, 95% CI 1.26–1.78, P = 3.8 × 10⁻⁶), KIRC (HR 1.31, 95% CI 1.06–1.62, P = 1.4 × 10⁻²), UCEC (HR 1.21, 95% CI 1.00–1.46, P = 4.4 × 10⁻²), and GBM (HR 1.26, 95% CI 1.02–1.57, P = 3.3 × 10⁻²). FTH1 expression was significantly associated with PFI in eight cancer types (Figure 3D): PRAD (HR 1.89, 95% CI 1.21–2.95, P = 5.5 × 10⁻³), KIRP (HR 1.83, 95% CI 1.29–2.6, P = 6.9 × 10⁻⁴), CESC (HR 1.5, 95% CI 1.13–1.99, P = 5.3 × 10⁻³), HNSC (HR 1.35, 95% CI 1.13–1.6, P = 6.9 × 10⁻⁴), LGG (HR 1.67, 95% CI 1.26–2.21, P = 3.4 × 10⁻⁴), DLBC (HR 0.47, 95% CI 0.24–0.92, P = 2.7 × 10⁻²), KICH (HR 5, 95% CI 1.55–16.19, P = 7.2 × 10⁻³), and UVM (HR 2.97, 95% CI 1.23–7.16, P = 1.6 × 10⁻²). As was observed for OS, poor PFI was significantly associated with high FTL (Figure 3B, 3C) or high FTH1 (Figure 3E–3J) mRNA levels in some cancers.
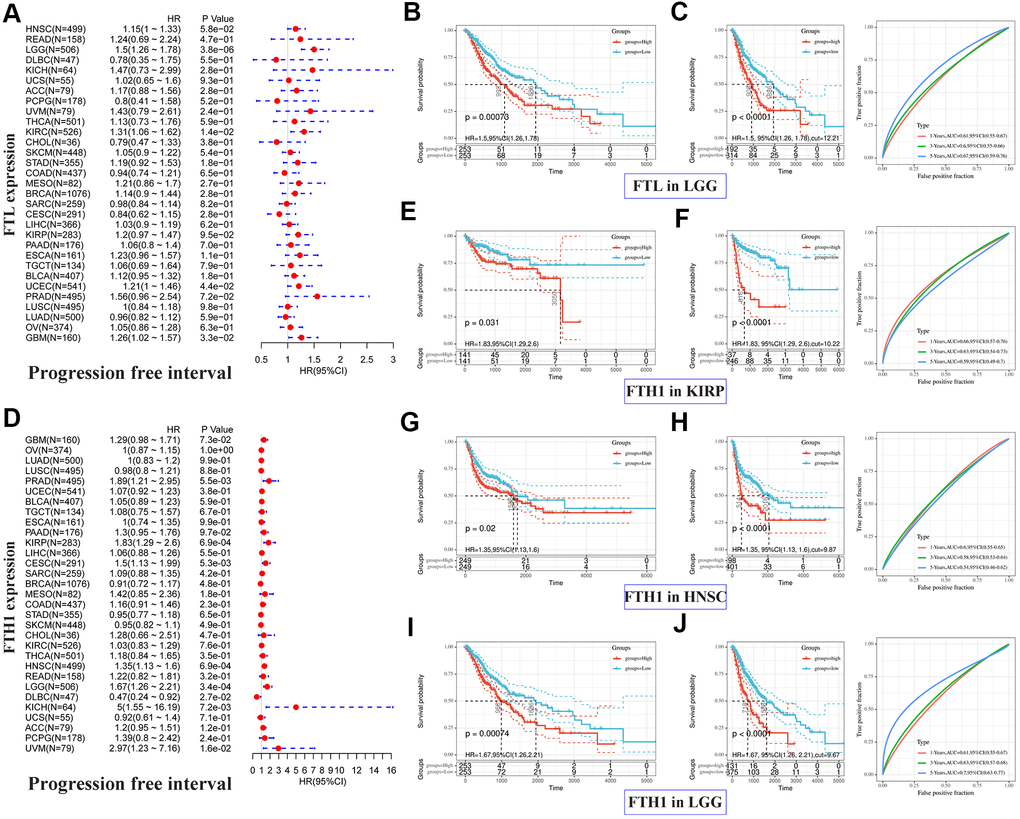
Figure 3. Positive correlations between high FTL and FTH1 expressions and poor PFI in several tumors. (A) Univariate analysis showed the positive association between high FTL level and poor PFI in patients with LGG (P = 3.8 × 10⁻⁶), KIRC (P = 1.4 × 10⁻²), UCEC (4.4 × 10⁻²), GBM (P = 3.3 × 10⁻²). (B, C) High FTL mRNA level was related to poor OS in LGG (HR 1.5, 95% CI 1.26–1.78, P = 7.3 × 10⁻⁴). (D) Univariate analysis showed the positive association between high FTH1 level and poor PFI in patients with PRAD (P = 5.5 × 10⁻³), KIRP (P = 6.9 × 10⁻⁴), CESC (P = 5.3 × 10⁻³), HNSC (P = 6.9 × 10⁻⁴), LGG (P = 3.4 × 10⁻⁴), KICH (P = 7.2 × 10⁻³), UVM (P = 1.6 × 10⁻²), and the negative association with DLBC (P = 2.7 × 10⁻²). (E–J) High FTH1 mRNA level was related to poor PFI in KIRP (HR 1.83, 95% CI 1.29–2.6, P = 3.1 × 10⁻²), HNSC (HR 1.35, 95% CI 1.13–1.6, P = 2 × 10⁻²), LGG (HR 1.67, 95% CI 1.26–2.21, P = 7.4 × 10⁻⁴). Only the tumors with P < 0.001 in univariate analysis will do the further Kaplan–Meier and ROC analysis.
FTL and FTH1 levels correlate positively with immune checkpoint markers
To clarify the potential role of FTL and FTH1 in tumor immunity, we next examined correlations between the expressions of FTL and FTH1 and 47 distinct immune-related markers using Pearson Correlation Coefficient analysis. As shown in Figure 4A, we found that FTL levels were positively related to PD-1 in 14/32 cancers (43.8%), PD-L1 in 10/32 (31.3%), CTLA4 in 13/32 (40.6%), TIM-3 in 26/32 (81.3%), LAG3 in 13/32 (40.6%), and LAIR1 in 26/32 (81.3%). FTH1 levels (Figure 4B) were positively related to PD-1 in 4/32 (12.5%) cancers, PD-L1 in 9/32 (28.1%), CTLA4 in 7/32 (21.9%), TIM-3 in 20/32 (62.5%), LAG3 in 2/32 (6.3%), and LAIR1 in 19/32 (59.4%). Interestingly, TIM-3 was positively related to FTL and FTH1 in the most cancers, so does LAIR1 (Figure 4A, 4B).
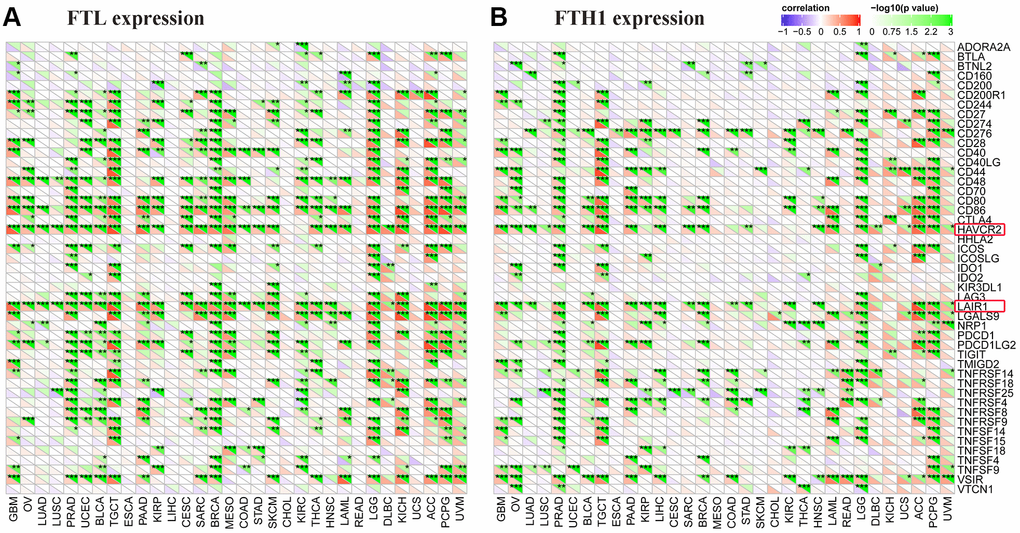
Figure 4. FTL and FTH1 levels were positively correlated with some of 47 distinct immune-related markers in 32 solid tumors. (A) FTL level was positively related to some immune-related markers, of which the most 2 were TIM-3 (26/32, 81.3%) and LAIR1 (26/32, 81.3%). Besides, FTL level was positively related to PD-1 in 14/32 cancers (43.8%), PD-L1 in 10/32 (31.3%), CTLA4 in 13/32 (40.6%), and LAG3 in 13/32 (40.6%). (B) FTH1 level was positively related to some immune-related markers, of which the most 2 were TIM-3 (20/32, 62.5%) and LAIR1 (19/32, 59.4%). Besides, FTH1 level was positively related to PD-1 in 4/32 (12.5%) cancers, PD-L1 in 9/32 (28.1%), CTLA4 in 7/32 (21.9%), and LAG3 in 2/32 (6.3%).
FTL and FTH1 levels correlate positively with immune score in most cancers
Given these findings that expressions of both FTL and FTH1 correlated strongly with the expression of immune-related markers in many cancers (Figure 4A, 4B), we next investigated correlations with the Immune Score, which itself is known to correlate strongly with patient survival [14]. FTL expression (Figure 5A) correlated positively with Immune Score in most cancers (28/32, 87.5%), with only READ, ESCA, COAD, and CHOL displaying no correlation. Similarly, FTH1 expression (Figure 5C) was positively correlated with Immune Score in most cancers (22/32, 68.8%), negatively correlated in 1 (3.1%; CESC), and was not correlated in 9/32 (28.1%; KICH, LUAD, LUSC, UCEC, ESCA, MESO, CHOL, THCA, HNSC).
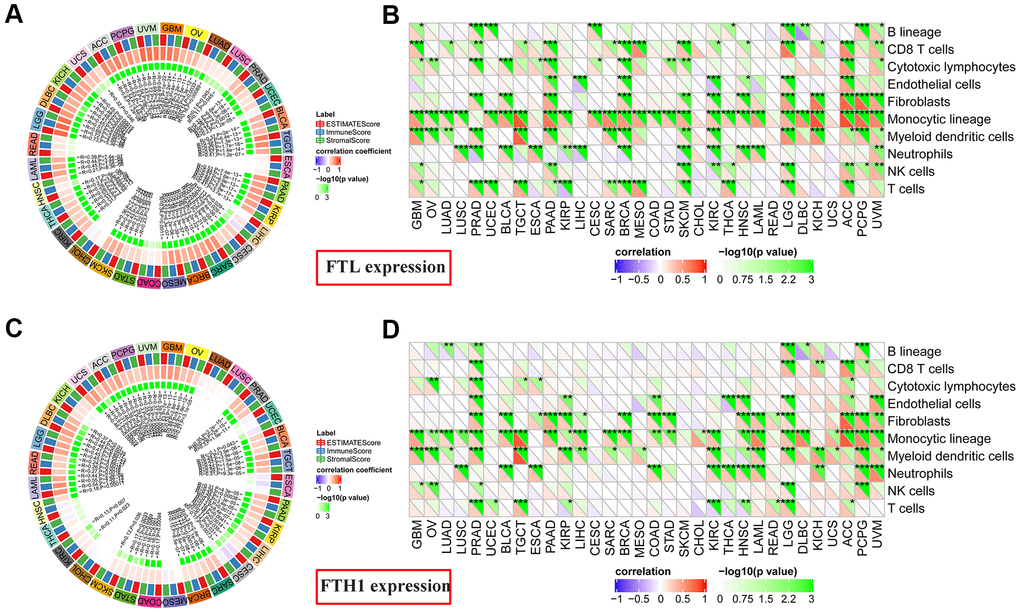
Figure 5. Correlations between FTL and FTH1 expression levels and immune cell infiltration determined using Estimate Immune Score and MCP-counter analyses. (A) FTL level was correlated positively with Immune Score in most cancers (28/32, 87.5%), with only READ, ESCA, COAD, and CHOL displaying no correlation. (B) MCP-counter analysis revealed positive associations between FTL expression and several cell subsets, of which the most 3 were monocytic lineage cells (26/32, 81.3%), CD8 T cell (15/32, 46.9%), and myeloid dendritic cells in (15/32, 46.9%). (C) FTH1 level was positively correlated with Immune Score in most cancers (22/32, 68.8%), negatively correlated in 1 (3.1%; CESC), and was not correlated in 9/32 (28.1%; KICH, LUAD, LUSC, UCEC, ESCA, MESO, CHOL, THCA, HNSC). (D) MCP-counter analysis revealed positive associations between FTH1 expression and several cell subsets, of which the most 3 were monocytic lineage cells (24/32, 75.0%), myeloid dendritic cells (17/32, 53.1%), and fibroblasts (16/32, 50.0%).
FTL and FTH1 levels correlate positively with infiltration of Tregs and TAMs in most cancers
To determine the source(s) of the correlation between FTL and FTH1 levels and Immune Score in most cancers, we examined correlations between expression and tumor-infiltrating cell subsets using MCP-counter, TIMER, and TIMINER. First, MCP-counter analysis revealed positive associations between FTL expression (Figure 5B) and several cell subsets, predominantly monocytic lineage cells (26/32, 81.3%), CD8 T cell (15/32, 46.9%), and myeloid dendritic cells in (15/32, 46.9%), while FTH1 expression (Figure 5D) was most clearly associated with monocytic lineage cells (24/32, 75.0%), myeloid dendritic cells (17/32, 53.1%), and fibroblasts (16/32, 50.0%).
TIMER analysis revealed that FTL expression and CD4+ T cells (Figure 6A) were positively correlated in 11/31 (35.5%) cancers, negatively correlated in 2/31 (6.5%), and was not correlated in 18/31 (58.1%). FTL expression and CD8+ T cells (Figure 6A) were positively correlated in 15/31 (48.4%), negatively correlated in 3/31 (9.7%), and not correlated in 13/31 (41.9%). Similarly, FTH1 and CD4+ T cells (Figure 6C) were positively correlated in 7/31 (22.6%), negatively correlated in 2/31 (6.5%), and not correlated in 22/31 (71.0%). FTH1 and CD8+ T cells (Figure 6C) were positively correlated in 7/31 (22.6%), negatively correlated in 3/31 (9.7%), and not correlated in 21/31 (67.7%).
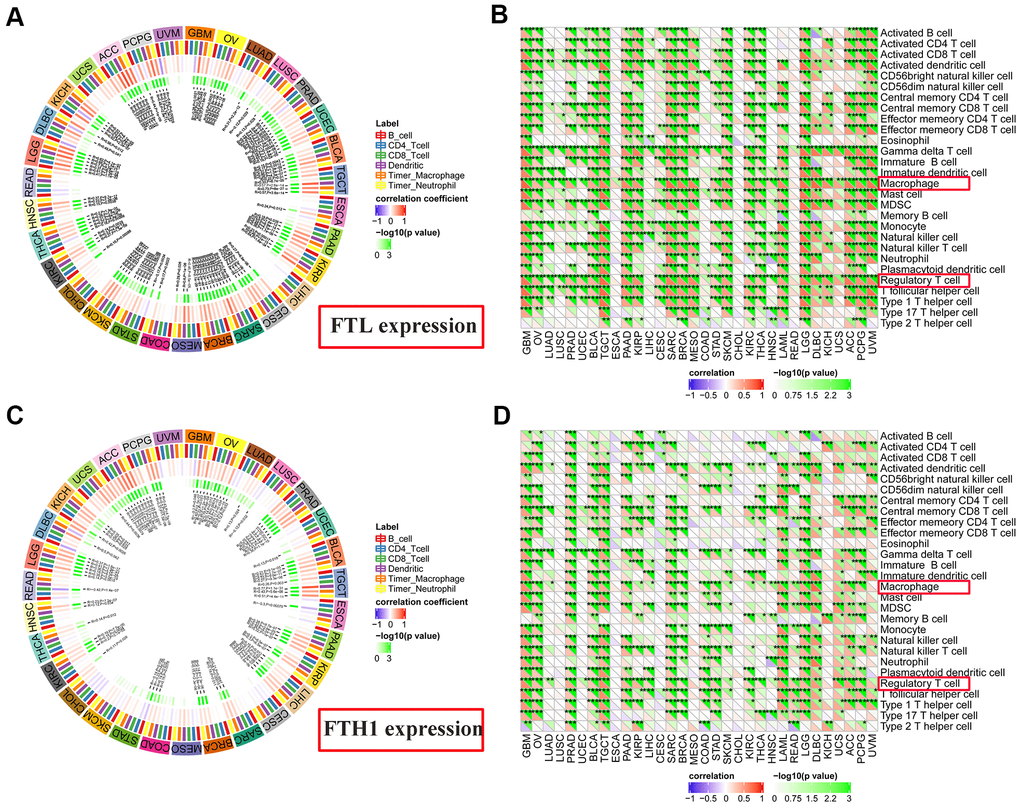
Figure 6. Correlations between FTL and FTH1 expressions and immune cell infiltration determined using TIMER and TIMINER analyses. (A) TIMER analysis of the association between FTL expression and B cells, CD4+ T cells, CD8+ T cells, dendritic cells, TAMs and neutrophils in 31 solid tumors. (B) TIMINER analysis of the positive association between FTL expression and 28 immune cell subtypes, of which the most 3 were gamma delta T cells (29/32, 90.6%), Tregs (28/32, 87.5%), and TAMs (28/32, 87.5%). (C) TIMER analysis of the association between FTH1 expression and B cells, CD4+ T cells, CD8+ T cells, dendritic cells, TAMs and neutrophils in 31 solid tumors. (D) TIMINER analysis of the positive association between FTH1 expression and 28 immune cell subtypes, of which the most 3 were Tregs (25/32, 78.1%), TAMs (24/32, 75.0%), and activated dendritic cells (24/32, 75.0%).
Finally, TIMINER was employed to further analyze the associations between FTL and FTH1 expressions and other subtypes of tumor-infiltrating immune cells. Interestingly, although the use of both MCP-counter and TIMER identified positive correlations between FTL and FTH1 expressions and CD4+ or CD8+ T cells in fewer than 50% of the cancer types examined, analysis of TIMINER identified a much higher rate of association between FTL and FTH1 expressions and tumor-infiltrating immune cell subsets. Thus, FTL expression (Figure 6B) was associated most strongly with gamma delta T cells in 29/32 (90.6%) cancers, Tregs in 28/32 (87.5%), and TAMs in 28/32 (87.5%), while FTH1 expression (Figure 6D) was most strongly associated with Tregs in 25/32 (78.1%), TAMs in 24/32 (75.0%), and activated dendritic cells in 24/32 (75.0%). Furthermore, there is a positive correlation between FTH1 and FTL levels and CD163, the scavenger marker of M2 TAMs (Supplementary Figure 1). These data demonstrated that both Tregs and TAMs were positively correlated with expression of ferritin subunits in most cancers.
Discussion
Increasing recognition that iron metabolism plays complex roles in cancer biology has fueled intense interest in the iron storage protein ferritin [1, 17], particularly for its roles as a mediator of the Fenton reaction in mitochondrial oxidative phosphorylation, as an integral player in the iron-dependent cell death pathway ferroptosis, and its potential utility as a drug nanocarrier [18]. FTH1 specifically binds to transferrin receptor 1, which is upregulated in most malignant cells [19, 20], thereby allowing ferritin-mediated targeted drug delivery [21] with the goal of enhancing efficacy [20, 22, 23]. Iron is an essential element in supporting cell proliferation and often accumulates in cancer cells; however, excessive levels of Fe2+ can promote the Fenton reaction, production of reactive oxygen species, and cell death through apoptosis [17] and ferroptosis [18].
Upregulation of ferritin has been shown to correlate with poor prognosis in several cancers, including HNSC, non-small cell lung cancer, and liver cancer [24, 25]. Nevertheless, apart from two studies showing that FTL is elevated in GBM and colorectal cancer [26, 27], little is known about the expressions of FTL and FTH1 in cancer. In the present study, we found that FTL is upregulated in most of the 27 cancers examined, which is consistent with findings in other cancers and is likely related to the essential role of ferritin in cell proliferation [1, 28, 29]. We also showed that FTL expression is positively related to poor prognosis in seven cancers, particularly LGG, and that FTL expression is elevated significantly in six of those cancers. FTL can accelerate the storage efficiency of Fe3+ [28, 29]. Correlations between FTL protein level and poor prognosis have been identified in node-negative breast cancer [30] and colorectal cancer [26], but these findings were not confirmed in our study. This discrepancy may be due to the different patient selection criteria. For example, the study by Gabriel et al. analyzed only patients with node-negative breast cancer [30], whereas the lymph node metastasis status was not a factor in the breast cancer dataset evaluated here.
In contrast to FTL, FTH1 expression was downregulated in 22 and upregulated in four of the 27 cancers examined in our study. We found that high FTH1 expression is positively related to poor prognosis in 11 cancers, including HNSC, which is consistent with our previous study [4]. Among these 11 cancers, the FTH1 level was significantly downregulated in nine cancers and significantly upregulated in two (KIRP, HNSC) compared with normal tissues. FTH1 possesses ferroxidase activity and converts Fe2+ into Fe3+, its combination with FTL can efficiently reduce the toxicity of Fe2+ [28, 29]. In cancer cells, FTH1 is thought to be a bifunctional molecule. Flavia et al. [31] found that increased intracellular levels of FTH1 can enhance P53 expression and reduce the proliferation of non-small cell lung cancer. However, Salatino et al. [29] showed that FTH1 is critical for proper functioning of the antioxidant system in ovarian cancer cells, suggesting that inhibition of FTH1 may improve cisplatin-induced cytotoxicity. In addition, the subcellular localization of FTH1 can affect its functions. Liu showed that a high cytoplasmic FTH1 level correlates with a favorable prognosis, whereas nuclear FTH1 is an adverse indicator, in triple negative breast cancer patients [32]. It is still unclear which factors control the translocation of FTH1. Clearly, FTH1 has multiple complex functions in cancer cells, and a broader understanding of its roles is urgently needed.
Advances in our understanding of anti-tumor immunity have made targeted immunotherapies the most promising treatment methods for many cancers [33, 34]. In the present study, we found that expressions of FTL and FTH1 correlated positively with levels of the immune checkpoint proteins TIM-3 and LAIR1, both of which can suppress tumor immunity [35–38]. TIM-3 is a negative regulator of cytotoxic and helper T cells and can promote the formation of a suppressive tumor microenvironment through the TIM-3–galectin-9 pathway [36, 39]. LAIR1 is widely expressed in immune cells where it negatively regulates cell activation through interaction with several ligands, especially collagen [37]. However, to our knowledge, the present study is the first to reveal these positive correlations between TIM-3 and LAIR1 levels and FTL and FTH1 levels. Moreover, few studies have assessed the influence of TIM-3 and LAIR1 on iron metabolism. We speculate that FTL and FTH1 may influence TIM-3 and LAIR levels by affecting immune cell infiltration into the tumor.
In addition to T cells, we investigated potential correlations between FTL and FTH1 expressions in solid tumors and infiltration of several other pivotal immune cells. Intriguingly, FTL and FTH1 levels are positively correlated with most of immune cells in some tumors, especially in LGG. However, both of them are positively correlated with the poor prognosis of LGG. Iron is essential for cell metabolism and proliferation [17], however, each immune cell type has its own metabolic adaptation in the tumor microenvironment [40]. We consider that the influence extent of FTL and FTH1 on different immune cells should be various. In other words, the increasing level of immunosuppressive cells, like M2 and Treg, could completely offset the effect of anti-tumor immune cells. However, this needs to be confirmed in a large number of future studies.
Moreover, our analyses revealed positive associations between FTL and FTH1 expressions and infiltration of both cell types in most cancers. Mounting evidence suggests that TAMs exhibit high plasticity and can switch between the anti-tumoral M1 subtype and the pro-tumoral M2 subtype, the latter of which is most abundant in solid tumors [41, 42]. Ricolleau reported that FTL is mainly stored in M2-like TAMs in node-negative breast cancer [43]. Cronin showed that M1-like macrophages can sequester iron and produce reactive oxygen species, and that M2-like macrophages release iron to promote tumor progression [2]. On the basis of these studies, we speculate that the positive correlation between FTL and FTH1 levels and TAMs may be due to the high demand for ferritin in M2 TAMs. However, whether FTL or FTH1 inhibition can induce M2-to-M1 repolarization will need to be investigated in future studies.
Finally, the present study shows that both FTL and FTH1 levels are positively correlated with Tregs infiltration in most cancers [44]. A similar correlation has recently been reported in melanoma [44]. Gray showed that melanoma cells secreting FTH1 could activate Tregs to produce interleukin-10 and suppress the immune response in vitro [45]. As noted, the present study is the first to propose a positive correlation between FTL and FTH1 expressions and Treg infiltration in most solid tumors through analysis of mRNA and clinicopathological data from TCGA. While a robust source of iron is necessary for metabolic and redox reactions to support the proliferation and effector functions of T cells [46], excessive levels of intracellular iron could induce cell death via induction of oxidative stress [7]. The present study suggests a need for comparable iron and ferritin homeostasis in Tregs, which are the most important immunosuppressive T-cell subset. To the best of our knowledge, no studies have yet examined whether targeted FTL or FTH1 therapy could influence Treg infiltration by decreasing ferritin expression, which holds promise as a new mechanism of iron-based therapy. Whether such therapy could also enhance the activity of immunotherapies is another question that should be addressed in future studies.
In summary, we have shown that the expressions of FTL and FTH1 mRNA is increased and decreased, respectively, in most of the 27 solid cancer types examined. Furthermore, both ferritin subunits may have important physiological functions in TAMs and Tregs, and thus may play key roles in tumor immunity. Our results suggest that therapies targeting iron and ferritin homeostasis could be developed as potential treatments to synergize with specific immunotherapies to enhance anti-tumor responses.
Materials and Methods
TCGA and GTEx datasets
The expression levels of genes in various types of cancers were downloaded from TCGA (https://www.cancer.gov/about-nci/organization/ccg/research/structural-genomics/tcga/, OV: ovarian serous cystadenocarcinoma, LUAD: lung adenocarcinoma, LUSC: lung squamous cell carcinoma, PRAD: prostate adenocarcinoma; UCEC: uterine corpus endometrial carcinoma, BLCA: bladder urothelial carcinoma, TGCT: testicular germ cell tumor, ESCA: esophageal carcinoma, PAAD: pancreatic adenocarcinoma, KIRP: kidney renal papillary cell carcinoma, LIHC: liver hepatocellular carcinoma, CESC: cervical squamous cell carcinoma and endocervical adenocarcinoma, SARC: sarcoma, BRCA: breast invasive carcinoma; MESO: mesothelioma, COAD: colon adenocarcinoma, STAD: stomach adenocarcinoma, SKCM: skin cutaneous melanoma, CHOL: cholangiocarcinoma, KIRC: kidney renal clear cell carcinoma, THCA: thyroid carcinoma, THYM: thymoma, HNSC, READ: rectum adenocarcinoma, LGG, DLBC: lymphoid neoplasm diffuse large B-cell lymphoma, KICH: kidney chromophobe, UCS: uterine carcinosarcoma, ACC: adrenocortical carcinoma, PCPG: pheochromocytoma and paraganglioma, UVM: uveal melanoma, GBM: glioblastoma multiforme). Gene expression datasets for the corresponding normal tissues were downloaded from the Genotype-Tissue Expression (GTEx) program (https://www.gtexportal.org/home/). Patients’ clinical information were organized in Supplementary Table 1. All gene expression data were normalized and are presented here as log2 of the transcript control per million +1.
Prognosis analysis
Overall survival (OS) and progression-free interval (PFI) data were obtained from TCGA. Univariate survival analysis was used to analyze correlations between FTL and FTH1 levels and OS and PFI separately, and cancers with significant associations at p<0.001 were further analyzed using the Kaplan–Meier method. Patients were assigned to low and high FTL and FTH1 expression groups using receiver operating characteristic (ROC) curve analysis, with the median expression level as the cutoff value. A multivariate Cox proportional hazard model was performed to evaluate the independent prognostic variables.
Estimate Score and MCP-counter
Expression data to identify cell subsets were downloaded from TCGA. The Immune Score, Stromal Score, and Estimate Score were calculated using R (version 3.6.3), RStudio (version 1.2.5033), and R Estimate package (version 1.0.13). The MCP-counter data were analyzed using R MCP-counter package (version 1.2.0).
TIMER and TIMINER
TIMER (https://cistrome.shinyapps.io/timer/) is a deconvolution tool to calculate the abundance of tumor-infiltrating immune cell subsets, including B cells, CD4+ T cells, CD8+ T cells, neutrophils, macrophages, and dendritic cells, in various human cancers. TIMINER (https://icbi.i-med.ac.at/software/timiner/timiner.shtml) is a computational framework that is based on the pre-ranked Gene Set Enrichment Analysis approach and was used here to define gene sets from 28 immune cell subtypes.
Statistical analysis
Differences in FTL and FTH1 expressions between tumor and normal tissues were compared using Student’s t-test. Survival data were analyzed by univariate and Kaplan–Meier analysis of patient populations stratified by ROC curve analysis. Associations between FTL and FTH1 expressions and tumor-infiltrating cells or immune-related markers were analyzed using Pearson’s Correlation Coefficient. P < 0.05 was considered statistically significant.
Author Contributions
Zhang-Wei Hu, Lin Chen, Wei Sun and Wei-Ping Wen conceived and designed the study. Yi-Hui Wen, Xue-Lan Zeng and Lin Chen downloaded the data, while Zhang-Wei Hu, Ren-Qiang Ma and Fan-Qin Wei analyzed the data. Zhang-Wei Hu wrote the paper. All authors read and approved the final manuscript.
Conflicts of Interest
The authors declare that they have no conflicts of interest.
Funding
This study was supported by the National Natural Science Foundation of China (NSFC) grants 81870696, 81670902 (W.P.W.) and 81972527 (W.S.), Guangdong Natural Science Foundation of China grants 2018B030312008 (W.P.W.), 2018A030313667 (Y.H.W.) and 2016A030310167 (R.Q.M.), Guangzhou Science and Technology Project of China grant 201704020098, 201605030003 (W.P.W.).
References
- 1. Brown RA, Richardson KL, Kabir TD, Trinder D, Ganss R, Leedman PJ. Altered iron metabolism and impact in cancer biology, metastasis, and immunology. Front Oncol. 2020; 10:476. https://doi.org/10.3389/fonc.2020.00476 [PubMed]
- 2. Cronin SJ, Woolf CJ, Weiss G, Penninger JM. The role of iron regulation in immunometabolism and immune-related disease. Front Mol Biosci. 2019; 6:116. https://doi.org/10.3389/fmolb.2019.00116 [PubMed]
- 3. Liu J, Gao L, Zhan N, Xu P, Yang J, Yuan F, Xu Y, Cai Q, Geng R, Chen Q. Hypoxia induced ferritin light chain (FTL) promoted epithelia mesenchymal transition and chemoresistance of glioma. J Exp Clin Cancer Res. 2020; 39:137. https://doi.org/10.1186/s13046-020-01641-8 [PubMed]
- 4. Hu Z, Wang L, Han Y, Li F, Zheng A, Xu Y, Wang F, Xiao B, Chen C, Tao Z. Ferritin: A potential serum marker for lymph node metastasis in head and neck squamous cell carcinoma. Oncol Lett. 2019; 17:314–22. https://doi.org/10.3892/ol.2018.9642 [PubMed]
- 5. Wu SJ, Zhang ZZ, Cheng NS, Xiong XZ, Yang L. Preoperative serum ferritin is an independent prognostic factor for liver cancer after hepatectomy. Surg Oncol. 2019; 29:159–67. https://doi.org/10.1016/j.suronc.2019.05.013 [PubMed]
- 6. Gao Y, Wang J, Zhou Y, Sheng S, Qian SY, Huo X. Evaluation of serum CEA, CA19-9, CA72-4, CA125 and ferritin as diagnostic markers and factors of clinical parameters for colorectal cancer. Sci Rep. 2018; 8:2732. https://doi.org/10.1038/s41598-018-21048-y [PubMed]
- 7. Vanoaica L, Richman L, Jaworski M, Darshan D, Luther SA, Kühn LC. Conditional deletion of ferritin h in mice reduces B and T lymphocyte populations. PLoS One. 2014; 9:e89270. https://doi.org/10.1371/journal.pone.0089270 [PubMed]
- 8. Jiang XP, Elliott RL. Decreased iron in cancer cells and their microenvironment improves cytolysis of breast cancer cells by natural killer cells. Anticancer Res. 2017; 37:2297–305. https://doi.org/10.21873/anticanres.11567 [PubMed]
- 9. Tury S, Assayag F, Bonin F, Chateau-Joubert S, Servely JL, Vacher S, Becette V, Caly M, Rapinat A, Gentien D, de la Grange P, Schnitzler A, Lallemand F, et al. The iron chelator deferasirox synergises with chemotherapy to treat triple-negative breast cancers. J Pathol. 2018; 246:103–14. https://doi.org/10.1002/path.5104 [PubMed]
- 10. Cancer Genome Atlas Research Network. Comprehensive genomic characterization defines human glioblastoma genes and core pathways. Nature. 2008; 455:1061–68. https://doi.org/10.1038/nature07385 [PubMed]
- 11. Carrot-Zhang J, Chambwe N, Damrauer JS, Knijnenburg TA, Robertson AG, Yau C, Zhou W, Berger AC, Huang KL, Newberg JY, Mashl RJ, Romanel A, Sayaman RW, et al, and Cancer Genome Atlas Analysis Network. Comprehensive analysis of genetic ancestry and its molecular correlates in cancer. Cancer Cell. 2020; 37:639–654.e6. https://doi.org/10.1016/j.ccell.2020.04.012 [PubMed]
- 12. Linehan WM, Spellman PT, Ricketts CJ, Creighton CJ, Fei SS, Davis C, Wheeler DA, Murray BA, Schmidt L, Vocke CD, Peto M, Al Mamun AA, Shinbrot E, et al, and Cancer Genome Atlas Research Network. Comprehensive molecular characterization of papillary renal-cell carcinoma. N Engl J Med. 2016; 374:135–45. https://doi.org/10.1056/NEJMoa1505917 [PubMed]
- 13. Yoshihara K, Shahmoradgoli M, Martínez E, Vegesna R, Kim H, Torres-Garcia W, Treviño V, Shen H, Laird PW, Levine DA, Carter SL, Getz G, Stemke-Hale K, et al. Inferring tumour purity and stromal and immune cell admixture from expression data. Nat Commun. 2013; 4:2612. https://doi.org/10.1038/ncomms3612 [PubMed]
- 14. Becht E, Giraldo NA, Lacroix L, Buttard B, Elarouci N, Petitprez F, Selves J, Laurent-Puig P, Sautès-Fridman C, Fridman WH, de Reyniès A. Erratum to: estimating the population abundance of tissue-infiltrating immune and stromal cell populations using gene expression. Genome Biol. 2016; 17:249. https://doi.org/10.1186/s13059-016-1113-y [PubMed]
- 15. Li T, Fan J, Wang B, Traugh N, Chen Q, Liu JS, Li B, Liu XS. TIMER: a web server for comprehensive analysis of tumor-infiltrating immune cells. Cancer Res. 2017; 77:e108–10. https://doi.org/10.1158/0008-5472.CAN-17-0307 [PubMed]
- 16. Charoentong P, Finotello F, Angelova M, Mayer C, Efremova M, Rieder D, Hackl H, Trajanoski Z. Pan-cancer immunogenomic analyses reveal genotype-immunophenotype relationships and predictors of response to checkpoint blockade. Cell Rep. 2017; 18:248–62. https://doi.org/10.1016/j.celrep.2016.12.019 [PubMed]
- 17. Sun H, Zhang C, Cao S, Sheng T, Dong N, Xu Y. Fenton reactions drive nucleotide and ATP syntheses in cancer. J Mol Cell Biol. 2018; 10:448–59. https://doi.org/10.1093/jmcb/mjy039 [PubMed]
- 18. Dixon SJ, Lemberg KM, Lamprecht MR, Skouta R, Zaitsev EM, Gleason CE, Patel DN, Bauer AJ, Cantley AM, Yang WS, Morrison B
3rd , Stockwell BR. Ferroptosis: an iron-dependent form of nonapoptotic cell death. Cell. 2012; 149:1060–72. https://doi.org/10.1016/j.cell.2012.03.042 [PubMed] - 19. Andreata F, Bonizzi A, Sevieri M, Truffi M, Monieri M, Sitia L, Silva F, Sorrentino L, Allevi R, Zerbi P, Marchini B, Longhi E, Ottria R, et al. Co-administration of H-ferritin-doxorubicin and Trastuzumab in neoadjuvant setting improves efficacy and prevents cardiotoxicity in HER2 + murine breast cancer model. Sci Rep. 2020; 10:11425. https://doi.org/10.1038/s41598-020-68205-w [PubMed]
- 20. Cheng X, Fan K, Wang L, Ying X, Sanders AJ, Guo T, Xing X, Zhou M, Du H, Hu Y, Ding H, Li Z, Wen X, et al. TfR1 binding with H-ferritin nanocarrier achieves prognostic diagnosis and enhances the therapeutic efficacy in clinical gastric cancer. Cell Death Dis. 2020; 11:92. https://doi.org/10.1038/s41419-020-2272-z [PubMed]
- 21. Mansourizadeh F, Alberti D, Bitonto V, Tripepi M, Sepehri H, Khoee S, Geninatti Crich S. Efficient synergistic combination effect of Quercetin with Curcumin on breast cancer cell apoptosis through their loading into Apo ferritin cavity. Colloids Surf B Biointerfaces. 2020; 191:110982. https://doi.org/10.1016/j.colsurfb.2020.110982 [PubMed]
- 22. He J, Fan K, Yan X. Ferritin drug carrier (FDC) for tumor targeting therapy. J Control Release. 2019; 311-312:288–300. https://doi.org/10.1016/j.jconrel.2019.09.002 [PubMed]
- 23. Pandolfi L, Bellini M, Vanna R, Morasso C, Zago A, Carcano S, Avvakumova S, Bertolini JA, Rizzuto MA, Colombo M, Prosperi D. H-ferritin enriches the curcumin uptake and improves the therapeutic efficacy in triple negative breast cancer cells. Biomacromolecules. 2017; 18:3318–30. https://doi.org/10.1021/acs.biomac.7b00974 [PubMed]
- 24. Song A, Eo W, Kim S, Shim B, Lee S. Significance of serum ferritin as a prognostic factor in advanced hepatobiliary cancer patients treated with Korean medicine: a retrospective cohort study. BMC Complement Altern Med. 2018; 18:176. https://doi.org/10.1186/s12906-018-2240-7 [PubMed]
- 25. Lee S, Jeon H, Shim B. Prognostic value of ferritin-to-hemoglobin ratio in patients with advanced non-small-cell lung cancer. J Cancer. 2019; 10:1717–25. https://doi.org/10.7150/jca.26853 [PubMed]
- 26. Li Z, Liu J, Chen H, Zhang Y, Shi H, Huang L, Tao J, Shen R, Wang T. Ferritin Light Chain (FTL) competes with long noncoding RNA Linc00467 for miR-133b binding site to regulate chemoresistance and metastasis of colorectal cancer. Carcinogenesis. 2020; 41:467–77. https://doi.org/10.1093/carcin/bgz181 [PubMed]
- 27. Wu T, Li Y, Liu B, Zhang S, Wu L, Zhu X, Chen Q. Expression of ferritin light chain (FTL) is elevated in glioblastoma, and FTL silencing inhibits glioblastoma cell proliferation via the GADD45/JNK pathway. PLoS One. 2016; 11:e0149361. https://doi.org/10.1371/journal.pone.0149361 [PubMed]
- 28. Timoshnikov VA, Kobzeva TV, Polyakov NE, Kontoghiorghes GJ. Inhibition of Fe(2+)- and Fe(3+)- induced hydroxyl radical production by the iron-chelating drug deferiprone. Free Radic Biol Med. 2015; 78:118–22. https://doi.org/10.1016/j.freeradbiomed.2014.10.513 [PubMed]
- 29. Salatino A, Aversa I, Battaglia AM, Sacco A, Di Vito A, Santamaria G, Chirillo R, Veltri P, Tradigo G, Di Cello A, Venturella R, Biamonte F, Costanzo F. H-ferritin affects cisplatin-induced cytotoxicity in ovarian cancer cells through the modulation of ROS. Oxid Med Cell Longev. 2019; 2019:3461251. https://doi.org/10.1155/2019/3461251 [PubMed]
- 30. Ricolleau G, Charbonnel C, Lodé L, Loussouarn D, Joalland MP, Bogumil R, Jourdain S, Minvielle S, Campone M, Déporte-Fety R, Campion L, Jézéquel P. Surface-enhanced laser desorption/ionization time of flight mass spectrometry protein profiling identifies ubiquitin and ferritin light chain as prognostic biomarkers in node-negative breast cancer tumors. Proteomics. 2006; 6:1963–75. https://doi.org/10.1002/pmic.200500283 [PubMed]
- 31. Biamonte F, Battaglia AM, Zolea F, Oliveira DM, Aversa I, Santamaria G, Giovannone ED, Rocco G, Viglietto G, Costanzo F. Ferritin heavy subunit enhances apoptosis of non-small cell lung cancer cells through modulation of miR-125b/p53 axis. Cell Death Dis. 2018; 9:1174. https://doi.org/10.1038/s41419-018-1216-3 [PubMed]
- 32. Liu NQ, De Marchi T, Timmermans AM, Beekhof R, Trapman-Jansen AM, Foekens R, Look MP, van Deurzen CH, Span PN, Sweep FC, Brask JB, Timmermans-Wielenga V, Debets R, et al. Ferritin heavy chain in triple negative breast cancer: a favorable prognostic marker that relates to a cluster of differentiation 8 positive (CD8+) effector T-cell response. Mol Cell Proteomics. 2014; 13:1814–27. https://doi.org/10.1074/mcp.M113.037176 [PubMed]
- 33. Bruni D, Angell HK, Galon J. The immune contexture and Immunoscore in cancer prognosis and therapeutic efficacy. Nat Rev Cancer. 2020; 20:662–80. https://doi.org/10.1038/s41568-020-0285-7 [PubMed]
- 34. Garner H, de Visser KE. Immune crosstalk in cancer progression and metastatic spread: a complex conversation. Nat Rev Immunol. 2020; 20:483–97. https://doi.org/10.1038/s41577-019-0271-z [PubMed]
- 35. Curley J, Conaway MR, Chinn Z, Duska L, Stoler M, Mills AM. Looking past PD-L1: expression of immune checkpoint TIM-3 and its ligand galectin-9 in cervical and vulvar squamous neoplasia. Mod Pathol. 2020; 33:1182–92. https://doi.org/10.1038/s41379-019-0433-3 [PubMed]
- 36. Tu L, Guan R, Yang H, Zhou Y, Hong W, Ma L, Zhao G, Yu M. Assessment of the expression of the immune checkpoint molecules PD-1, CTLA4, TIM-3 and LAG-3 across different cancers in relation to treatment response, tumor-infiltrating immune cells and survival. Int J Cancer. 2020; 147:423–39. https://doi.org/10.1002/ijc.32785 [PubMed]
- 37. Yang LL, Zhang MJ, Wu L, Mao L, Chen L, Yu GT, Deng WW, Zhang WF, Liu B, Sun WK, Sun ZJ. LAIR-1 overexpression and correlation with advanced pathological grade and immune suppressive status in oral squamous cell carcinoma. Head Neck. 2019; 41:1080–86. https://doi.org/10.1002/hed.25539 [PubMed]
- 38. Kim YK, Chu SH, Hsieh JY, Kamoku CM, Tenner AJ, Liu WF, Wang SW. Incorporation of a ligand peptide for immune inhibitory receptor LAIR-1 on biomaterial surfaces inhibits macrophage inflammatory responses. Adv Healthc Mater. 2017; 6:10.1002/adhm.201700707. https://doi.org/10.1002/adhm.201700707 [PubMed]
- 39. Das M, Zhu C, Kuchroo VK. Tim-3 and its role in regulating anti-tumor immunity. Immunol Rev. 2017; 276:97–111. https://doi.org/10.1111/imr.12520 [PubMed]
- 40. Leone RD, Powell JD. Metabolism of immune cells in cancer. Nat Rev Cancer. 2020; 20:516–31. https://doi.org/10.1038/s41568-020-0273-y [PubMed]
- 41. Zhang N, Liu C, Jin L, Zhang R, Wang T, Wang Q, Chen J, Yang F, Siebert HC, Zheng X. Ketogenic diet elicits antitumor properties through inducing oxidative stress, inhibiting MMP-9 expression, and rebalancing M1/M2 tumor-associated macrophage phenotype in a mouse model of colon cancer. J Agric Food Chem. 2020; 68:11182–96. https://doi.org/10.1021/acs.jafc.0c04041 [PubMed]
- 42. Xiao H, Guo Y, Li B, Li X, Wang Y, Han S, Cheng D, Shuai X. M2-like tumor-associated macrophage-targeted codelivery of STAT6 inhibitor and IKKβ siRNA induces M2-to-M1 repolarization for cancer immunotherapy with low immune side effects. ACS Cent Sci. 2020; 6:1208–22. https://doi.org/10.1021/acscentsci.9b01235 [PubMed]
- 43. Jézéquel P, Campion L, Spyratos F, Loussouarn D, Campone M, Guérin-Charbonnel C, Joalland MP, André J, Descotes F, Grenot C, Roy P, Carlioz A, Martin PM, et al. Validation of tumor-associated macrophage ferritin light chain as a prognostic biomarker in node-negative breast cancer tumors: A multicentric 2004 national PHRC study. Int J Cancer. 2012; 131:426–37. https://doi.org/10.1002/ijc.26397 [PubMed]
- 44. Sakaguchi S, Yamaguchi T, Nomura T, Ono M. Regulatory T cells and immune tolerance. Cell. 2008; 133:775–87. https://doi.org/10.1016/j.cell.2008.05.009 [PubMed]
- 45. Gray CP, Arosio P, Hersey P. Association of increased levels of heavy-chain ferritin with increased CD4+ CD25+ regulatory T-cell levels in patients with melanoma. Clin Cancer Res. 2003; 9:2551–59. [PubMed]
- 46. Cronin SJ, Penninger JM. From T-cell activation signals to signaling control of anti-cancer immunity. Immunol Rev. 2007; 220:151–68. https://doi.org/10.1111/j.1600-065X.2007.00570.x [PubMed]