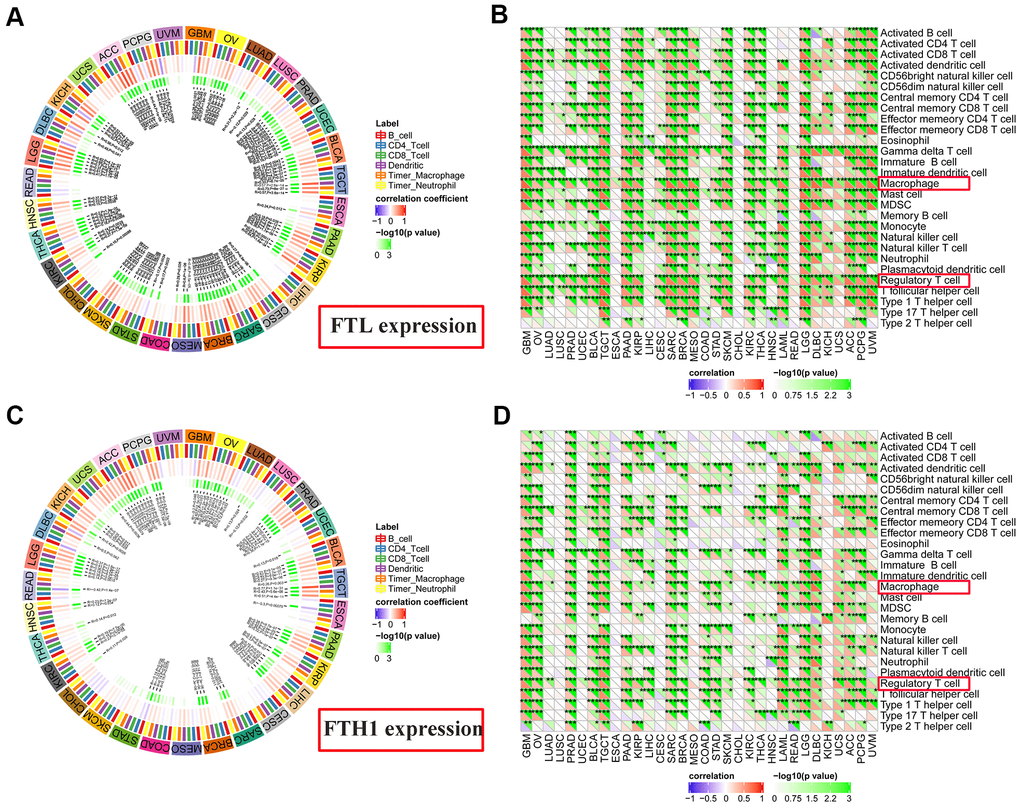
Figure 6.Correlations between FTL and FTH1 expressions and immune cell infiltration determined using TIMER and TIMINER analyses. (A) TIMER analysis of the association between FTL expression and B cells, CD4+ T cells, CD8+ T cells, dendritic cells, TAMs and neutrophils in 31 solid tumors. (B) TIMINER analysis of the positive association between FTL expression and 28 immune cell subtypes, of which the most 3 were gamma delta T cells (29/32, 90.6%), Tregs (28/32, 87.5%), and TAMs (28/32, 87.5%). (C) TIMER analysis of the association between FTH1 expression and B cells, CD4+ T cells, CD8+ T cells, dendritic cells, TAMs and neutrophils in 31 solid tumors. (D) TIMINER analysis of the positive association between FTH1 expression and 28 immune cell subtypes, of which the most 3 were Tregs (25/32, 78.1%), TAMs (24/32, 75.0%), and activated dendritic cells (24/32, 75.0%).