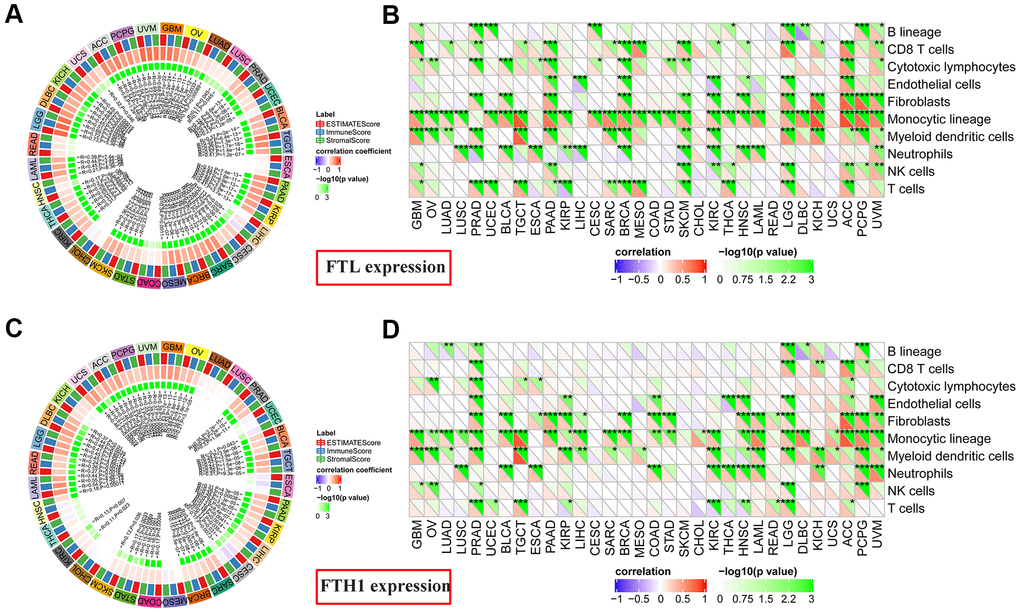
Figure 5.Correlations between FTL and FTH1 expression levels and immune cell infiltration determined using Estimate Immune Score and MCP-counter analyses. (A) FTL level was correlated positively with Immune Score in most cancers (28/32, 87.5%), with only READ, ESCA, COAD, and CHOL displaying no correlation. (B) MCP-counter analysis revealed positive associations between FTL expression and several cell subsets, of which the most 3 were monocytic lineage cells (26/32, 81.3%), CD8 T cell (15/32, 46.9%), and myeloid dendritic cells in (15/32, 46.9%). (C) FTH1 level was positively correlated with Immune Score in most cancers (22/32, 68.8%), negatively correlated in 1 (3.1%; CESC), and was not correlated in 9/32 (28.1%; KICH, LUAD, LUSC, UCEC, ESCA, MESO, CHOL, THCA, HNSC). (D) MCP-counter analysis revealed positive associations between FTH1 expression and several cell subsets, of which the most 3 were monocytic lineage cells (24/32, 75.0%), myeloid dendritic cells (17/32, 53.1%), and fibroblasts (16/32, 50.0%).