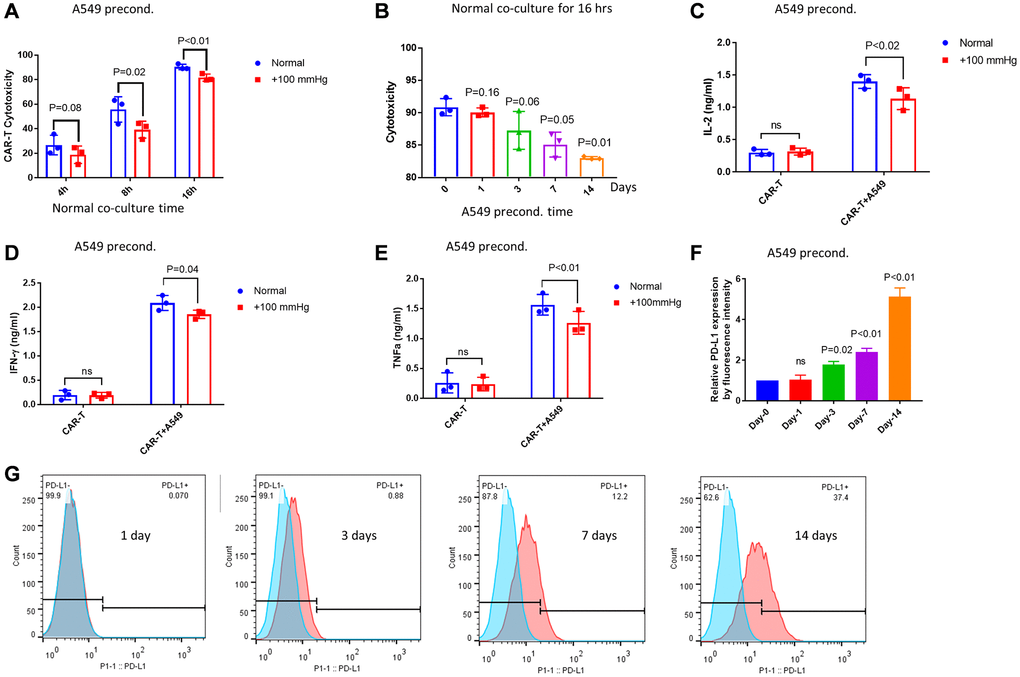
Figure 3.Pressure preconditioning A549 cells increased PD-L1 expression and caused resistance to αROR1-CAR T cell treatment. (A) A549-Red-Fluc cells preconditioned in pressurized incubator (+100 mmHg) for 7 days were co-cultured with non-preconditioned αROR1-CAR T cells under normal conditions. Cytotoxicity at indicated time points was calculated based on luciferase activity. (B) Pressure preconditioning decreased αROR1-CAR T cell cytotoxicity in a time-dependent manner. A549-Red-Fluc cells were preconditioned for indicated time and co-cultured with non-preconditioned αROR1-CAR T cells under normal conditions for 16 hours. αROR1-CAR T cytotoxicity were calculated by luciferase activity. (C–E) Cytokines (IL-2, IFN-γ and TNF-α) in the medium of co-culture shown in (B) were measured by ELISA. (F) PD-L1 expression in A549 cells was elevated by pressure. Data shown the quantification and statistical analysis of 2 biological repeats. (G) A typical experiment shown in (F). A549 cells were preconditioned for 1, 3, 7 and 14 days. Expression of PD-L1 was measured by flow cytometry and presented in histogram (red). Non-preconditioned A549 cells were used as controls (blue).