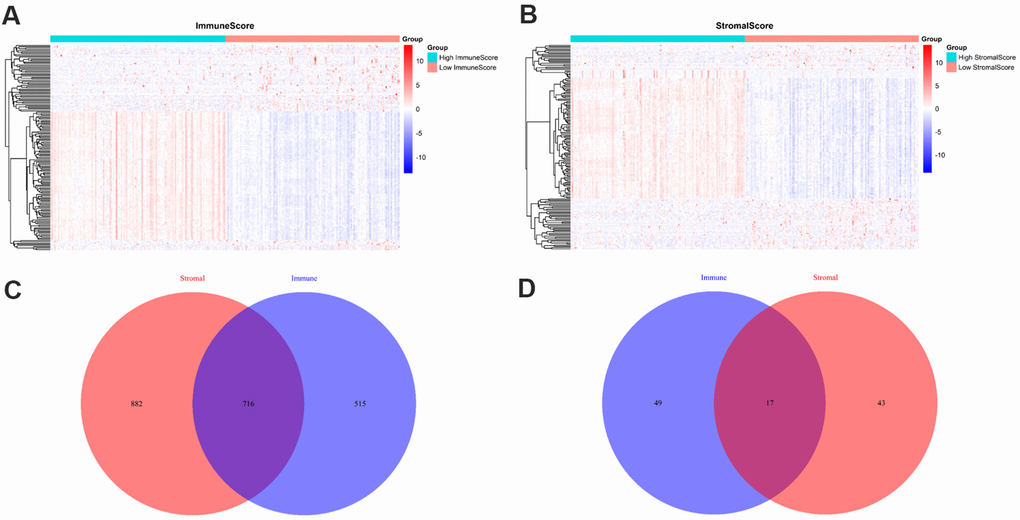
Figure 2.Comparison of gene expression profiles with immune and stromal scores. (A) A heat map of DEGs between the high and low immune score groups; (B) A heat map of DEGs between the high and low stromal score groups; (C) Venn diagrams showing the number of high expression and (D) low expression of DEGs in both immune and stromal score groups.