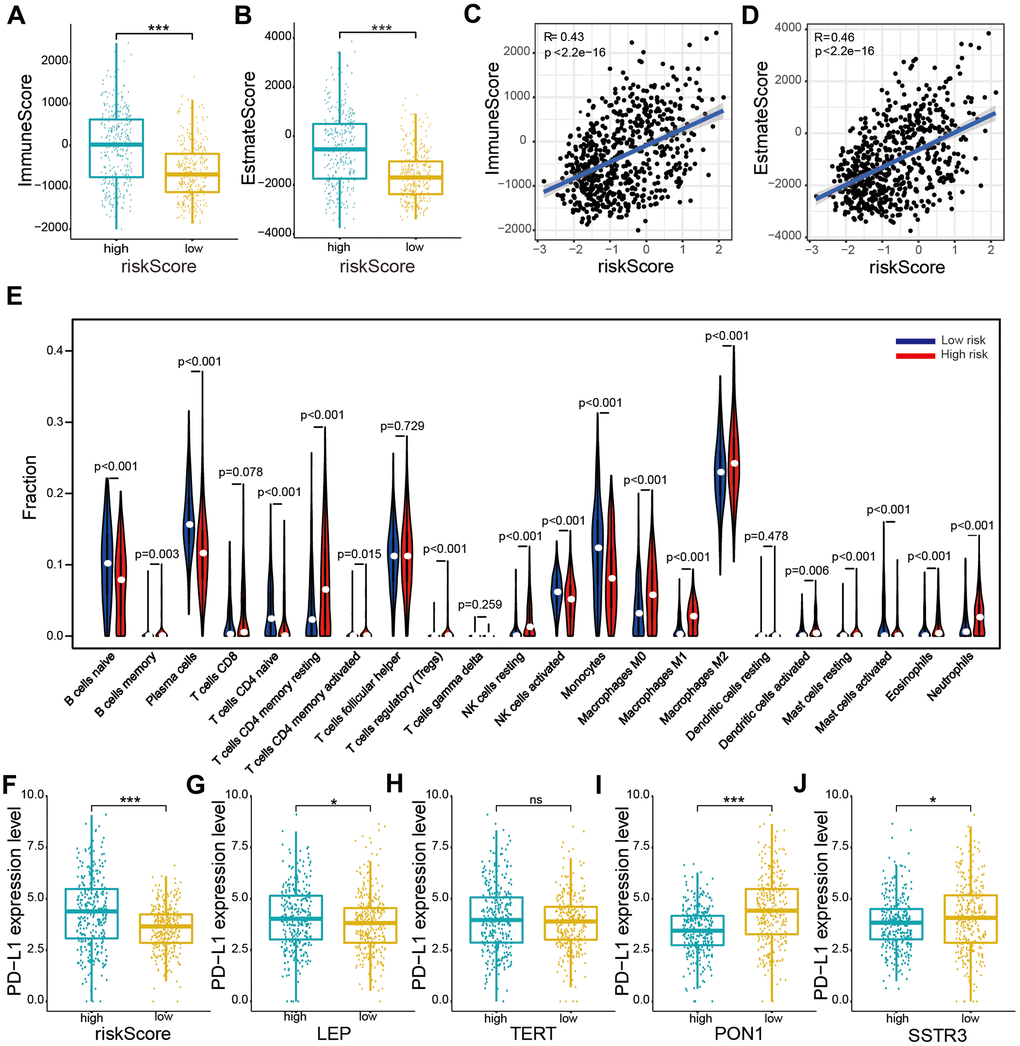
Figure 6.Relationships between the risk score and immune cell infiltration levels, and PD-L1 expression levels based on TCGA datasets. (A, B) Comparison of immune and estimate scores according to two subtypes grouped by the median risk score. (C, D) Relationship between the risk score and immune scores and the estimate score. (E) The violin plot showed distribution of the ratio differentiation of 22 kinds of immune cells in glioma samples according to two subtypes grouped by the median risk score. (F–J) Distribution of PD-L1 expression levels based on the risk score (F) and expression levels of the four selected AGs (LEP (G), TERT (H), PON1 (I), and SSTR3 (J)) of patients with glioma in the TCGA datasets. Non-significant (ns) P > 0.05, * P < 0.05, ** P < 0.01, and *** P < 0.001.