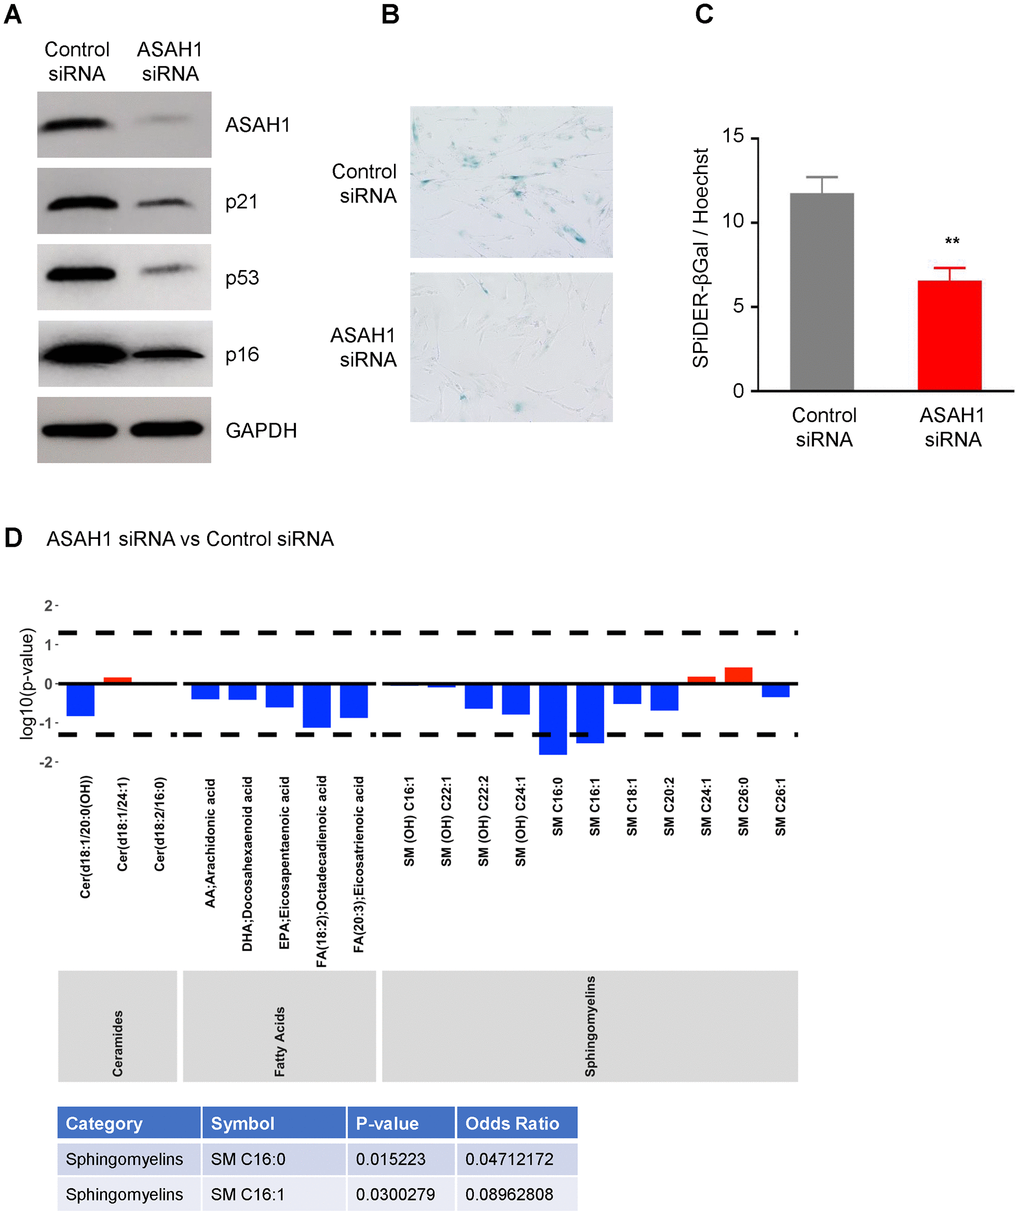
Figure 5.Silencing ASAH1 represses senescence. (A) Pre-senescent cells were transfected with either control or ASAH1 siRNA; 48 h after transfection cells were harvested and whole-cell lysates prepared for Western blot analysis to examine the levels of ASAH1, p16, p21, p53, and loading control GAPDH. (B, C) Detection of the senescent marker SA-βGal using traditional SA-βGal staining (B) and SPiDER-βGal (C) in the populations described in (A). (D) Metabolomic analysis of the levels of ceramides, fatty acids, and sphingomyelin after silencing ASAH1. Dashed lines indicate p < 0.05. The x-axis indicates the categories and individual metabolites. Red bars indicate a log odds ratio (OR) > 1: an increased log odds of a higher metabolite concentration in the ASAH1 group relative to the comparison group (Control siRNA). Blue bars indicate a log odds ratio (OR) < 1: a decreased log odds of a higher metabolite concentration in the ASAH1 group relative to the comparison group (Control siRNA). Significant metabolites are highlighted in the table below the graph.