Submit an Article
Navigate
Home
Editorial Board
Editorial Policies
Current Volume
Archive
Scientific Integrity
Publication Ethics Statements
Interviews with Outstanding Authors
Newsroom
Sponsored Conferences
Podcast
Contact
Special Collections
Submit an Article
Online ISSN: 1945-4589
Research Paper
|
Volume 13, Issue 12
|
pp. 16577–16599
Identification of differentially expressed genes-related prognostic risk model for survival prediction in breast carcinoma patients
Back to article
Figure 7
(7 of 9)
−
100%
+
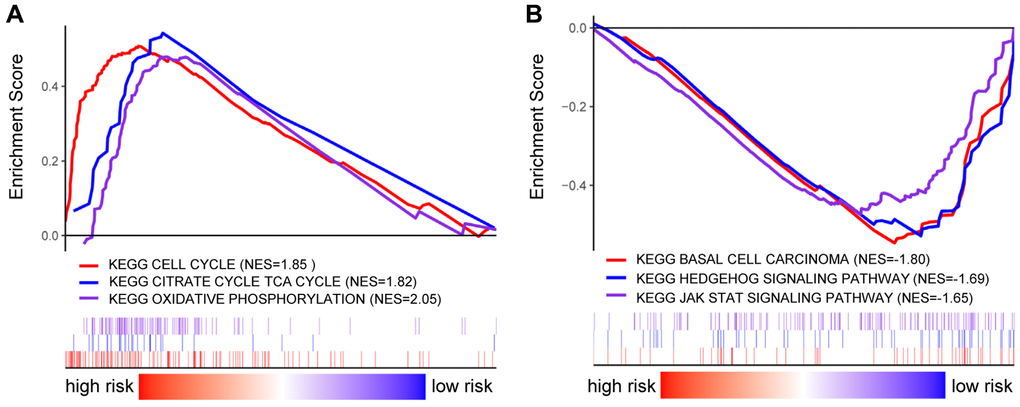
Figure 7.
GSEA analysis in BRCA patients with high- and low-risk score.
(
A
–
B
) GSEA displayed the KEGG enrichment pathways in BRCA patients with high- (
A
) and low-risk score (
B
).