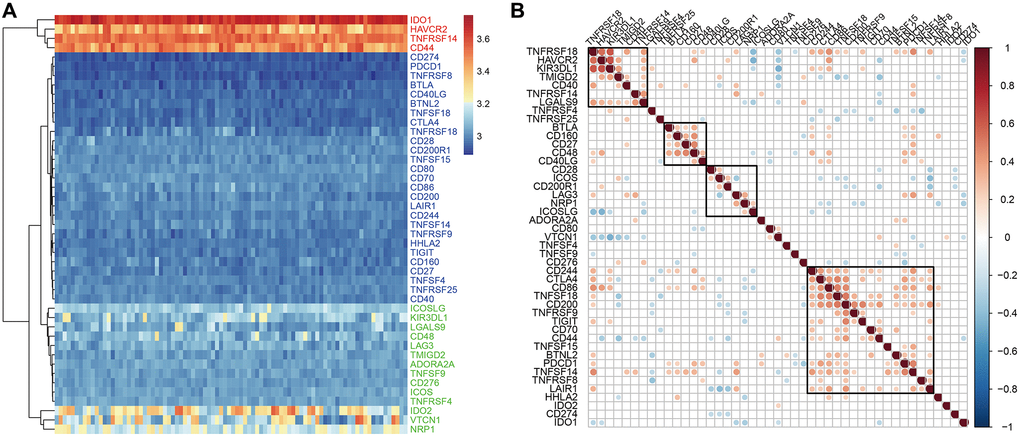
Figure 3.ICG expression in EC samples from the GSE77688 dataset. (A) Heat map shows expression levels of 47 ICGs in EC tissues from the GSE77688 data set. Red: high expression group; green: medium expression group; blue: low expression group. (B) Spearman correlation analysis shows relationship between various ICG pairs in EC tissues from the GSE77688 dataset. Note: Only ICG gene pairs with significant correlations are displayed; blank represents insignificant correlation.