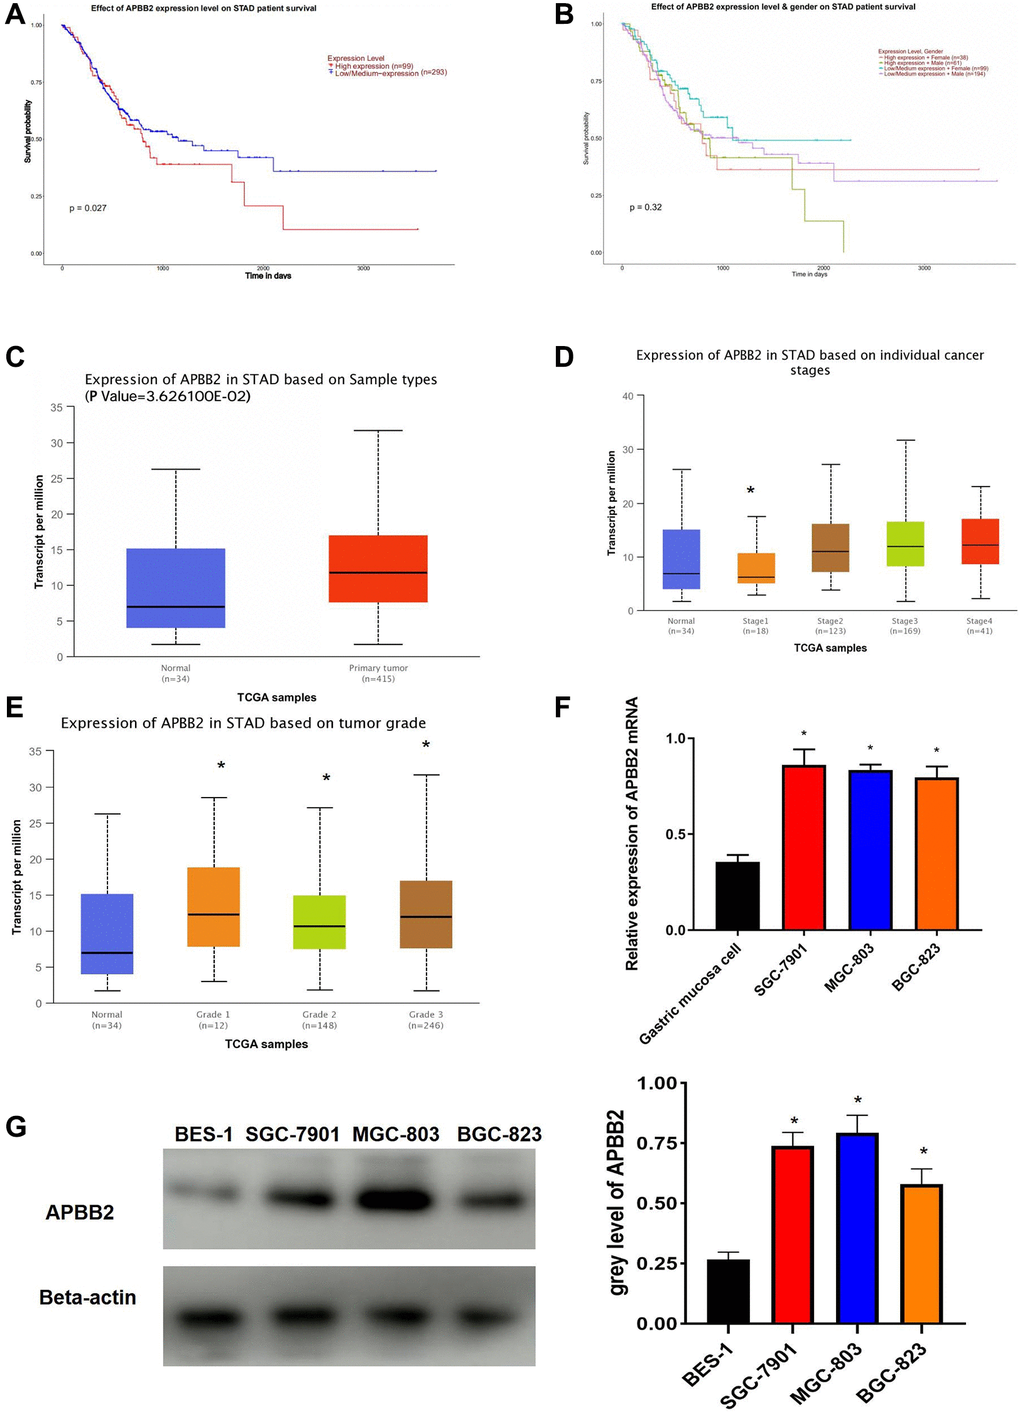
Figure 1.APBB2 expression and associated prognosis in GA. (A) Survival curves of APBB2 expression to evaluate patient prognosis in the TCGA-GA dataset. Red represents the high expression group and blue indicates low expression. (B) Survival curves of APBB2 expression to evaluate male and female patient prognosis in the TCGA-GA dataset. (C) Compared with the normal group (blue), high levels of APBB2 expression was observed in the tumor samples (red). (D and E) Box plots of APBB2 expression at different clinical stages, N stages of GA. (F and G) The level of APBB2 mRNA and protein expression in BES-1 and GA cell lines (SGC-7901, MGC-803, and BGC-823). *P < 0.05.