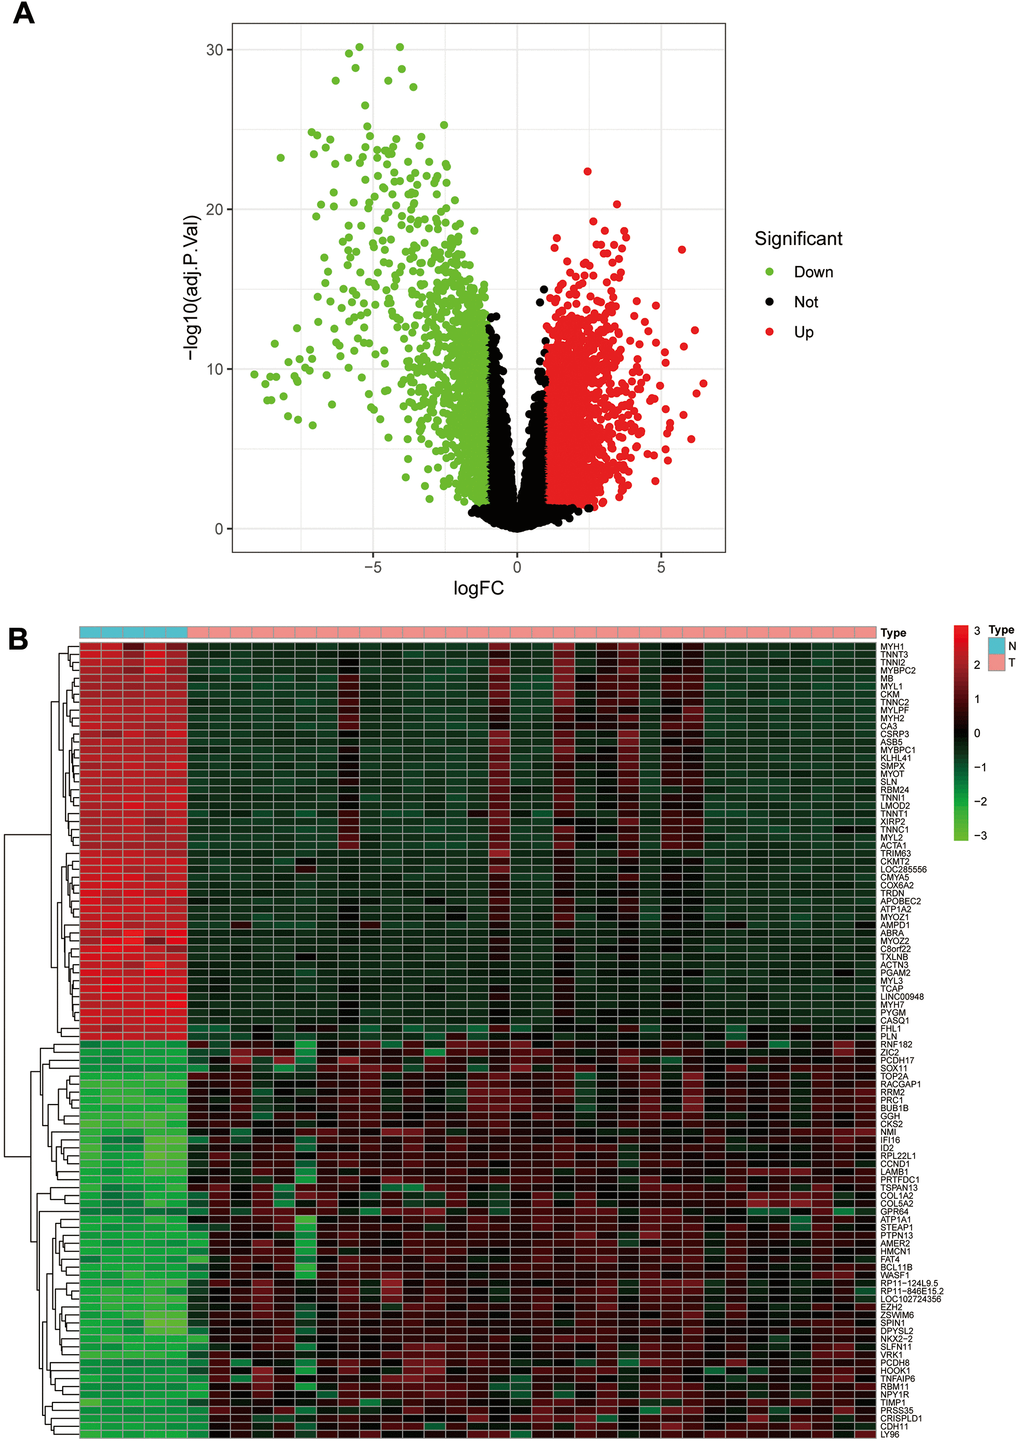
Figure 1.The volcano plot and heat map of differentially expressed genes. (A) The volcano plot; red dots are upregulated genes, green dots are downregulated genes, and black dots are nonsignificant differentially expressed genes. (B) The heat map; red rectangular blocks are highly expressed genes, and green rectangular blocks are poorly expressed genes.