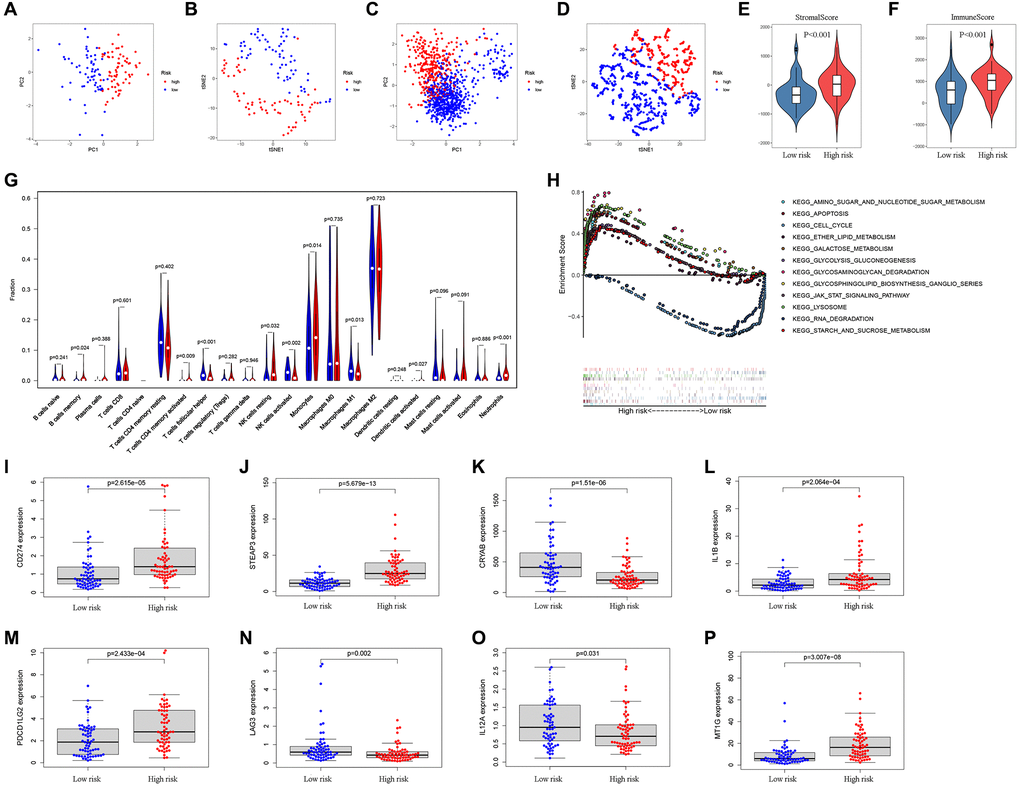
Figure 4.Analysis of differences between high- and low-risk subgroups (tumor microenvironment, immune cell infiltration, and immune checkpoint regulators). PCA (A) and t-SNE (B) analysis supported the stratification into two GBM subclasses the TCGA cohort. PCA (C) and t-SNE (D) analysis supported the stratification into two GBM subclasses the CGGA cohort. The comparison of stromal scores (E) and immune scores (F) in high- and low-risk subgroups. (G) The comparison of immune cell fractions between high- and low-risk subgroups. (H) The pathways enriched in high-risk GBM through GSEA analysis by enrichment map. (I–P) The key Immune checkpoint regulators with significant differential expression in the high- and low-risk subgroups.