Submit an Article
Navigate
Home
Editorial Board
Editorial Policies
Current Volume
Archive
Scientific Integrity
Publication Ethics Statements
Interviews with Outstanding Authors
Newsroom
Sponsored Conferences
Podcast
Contact
Special Collections
Submit an Article
Online ISSN: 1945-4589
Research Paper
|
Volume 13, Issue 14
|
pp. 18360–18375
Aberrant expression of WDR4 affects the clinical significance of cancer immunity in pan-cancer
Back to article
Figure 5
(5 of 11)
−
100%
+
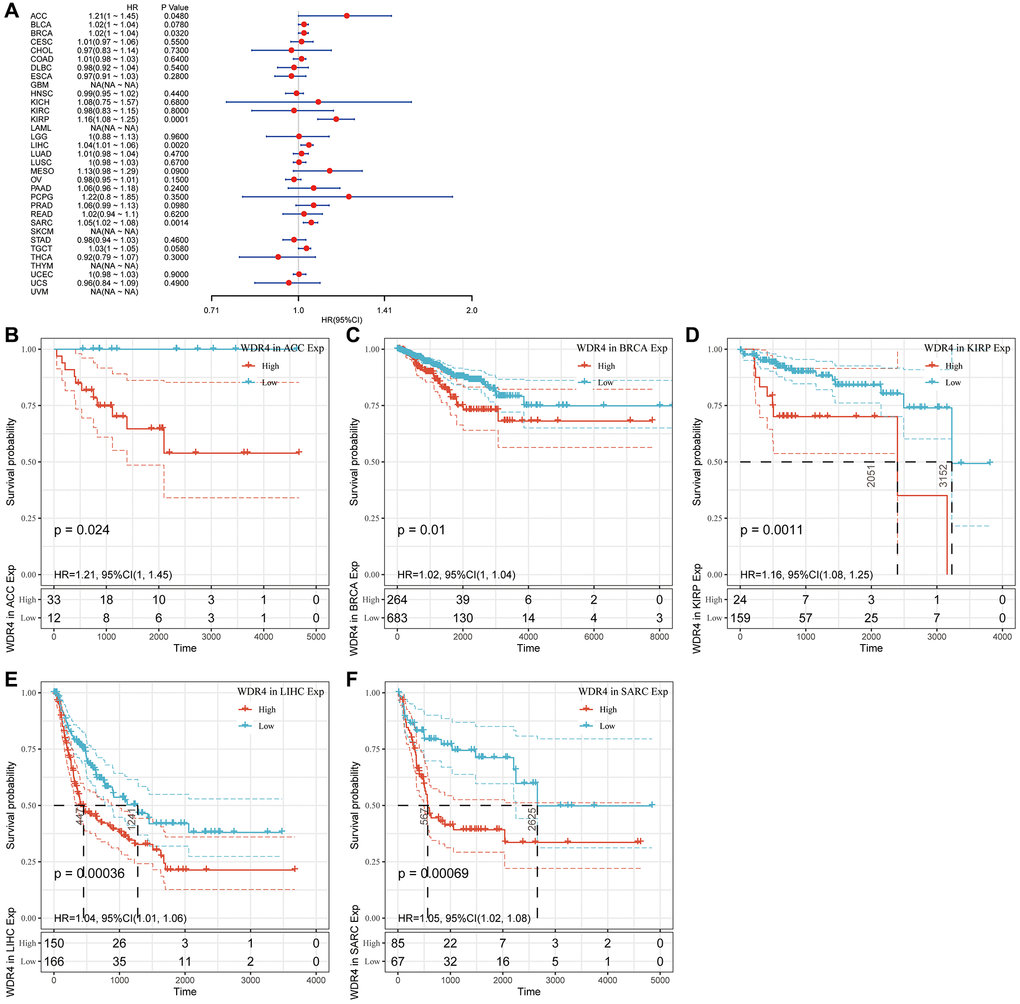
Figure 5.
Association of WDR4 expression with patient disease-free interval (DFI).
(
A
) The forest plot shows the relationship of WDR4 expression with DFI. (
B
–
F
) Kaplan-Meier analyses show the association between WDR4 expression and DFI.