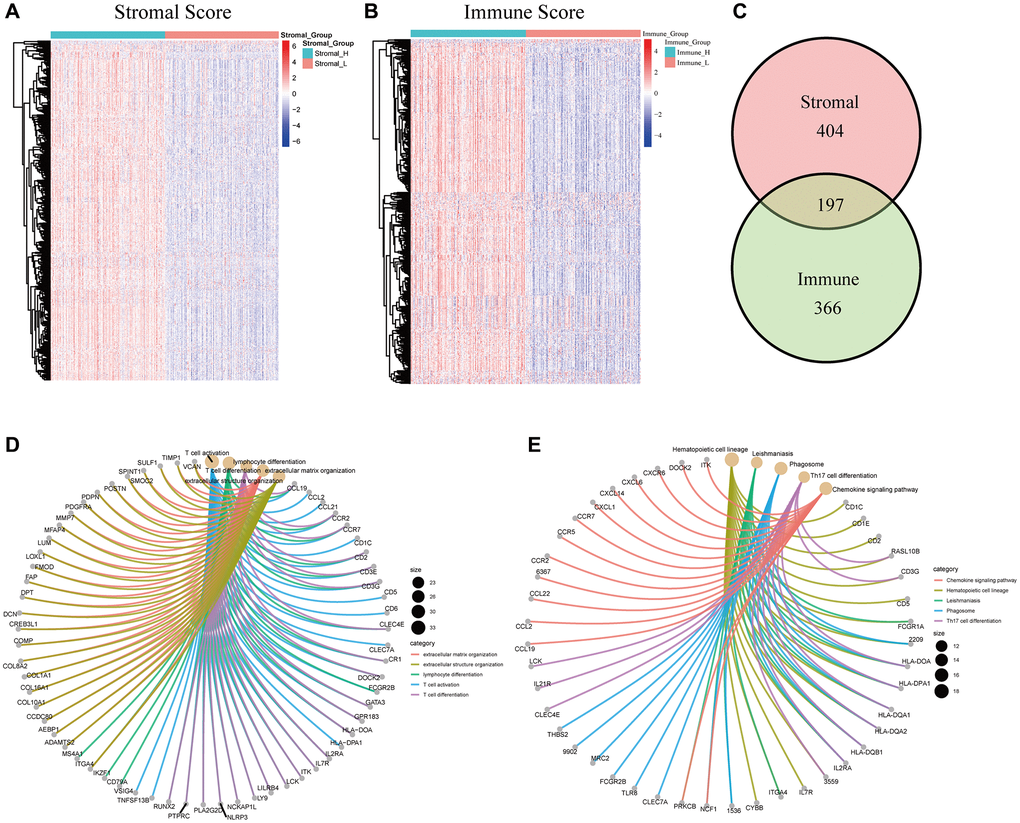
Figure 4.Cluster analysis, intersection analysis, GO, and KEGG enrichment analysis of the DEGs. (A) Heatmap of 601 DEGs between the high/low stromal score subgroups. (B) Heatmap of 563 DEGs between the high/low immune score subgroups. (C) Venn diagram of the DEGs commonly shared by the two groups. (D) GO enrichment analysis of the common DEGs. (E) KEGG enrichment analysis of the common DEGs.