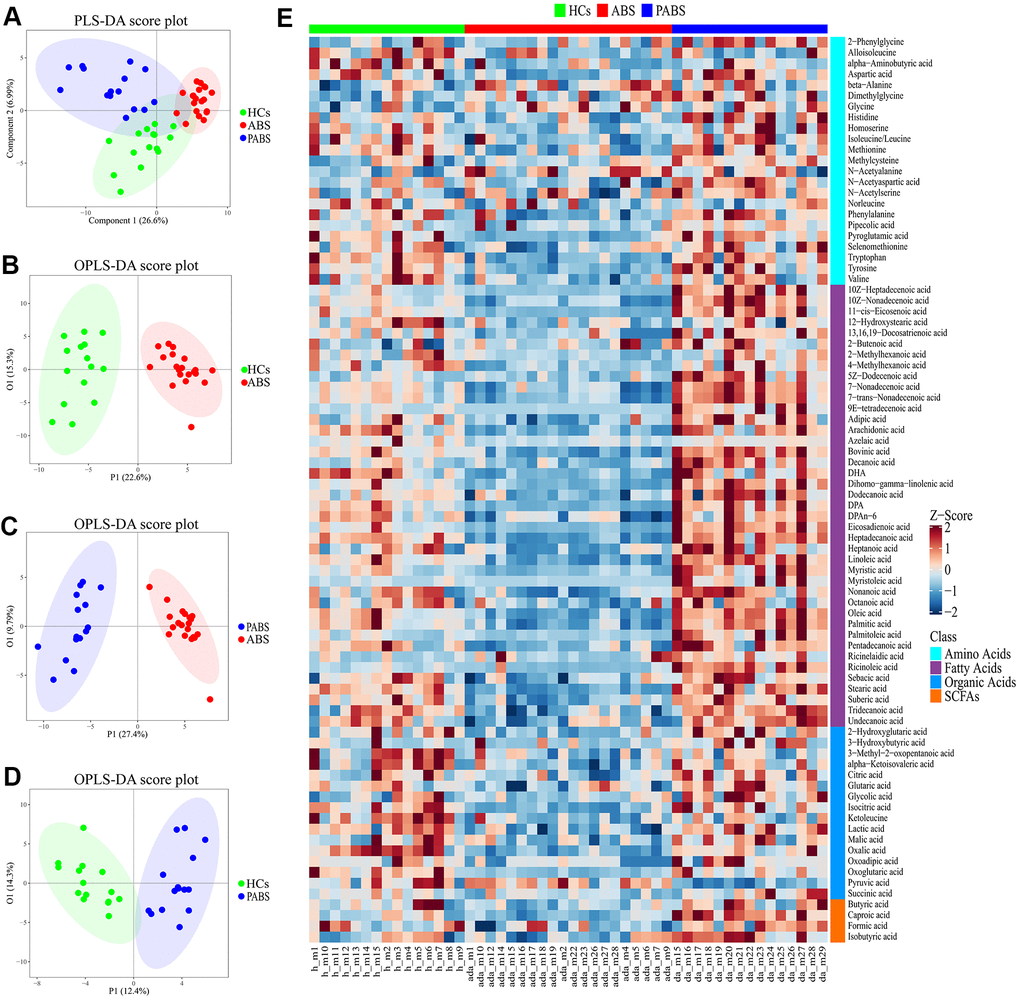
Figure 2.Obvious metabolic abnormalities during acute heroin withdrawal. (A) PLS-DA score plot of plasma samples obtained from the 3 groups. (B) OPLS-DA score plot showing separation by phenotype between healthy controls and acute heroin withdrawal. (C) OPLS-DA score plot showing separation by phenotype between long-term heroin withdrawal and acute heroin withdrawal. (D) OPLS-DA scores plot showing separation by phenotype between healthy controls and long-term heroin withdrawal. (E) The heatmap of differential metabolites between the 3 groups.