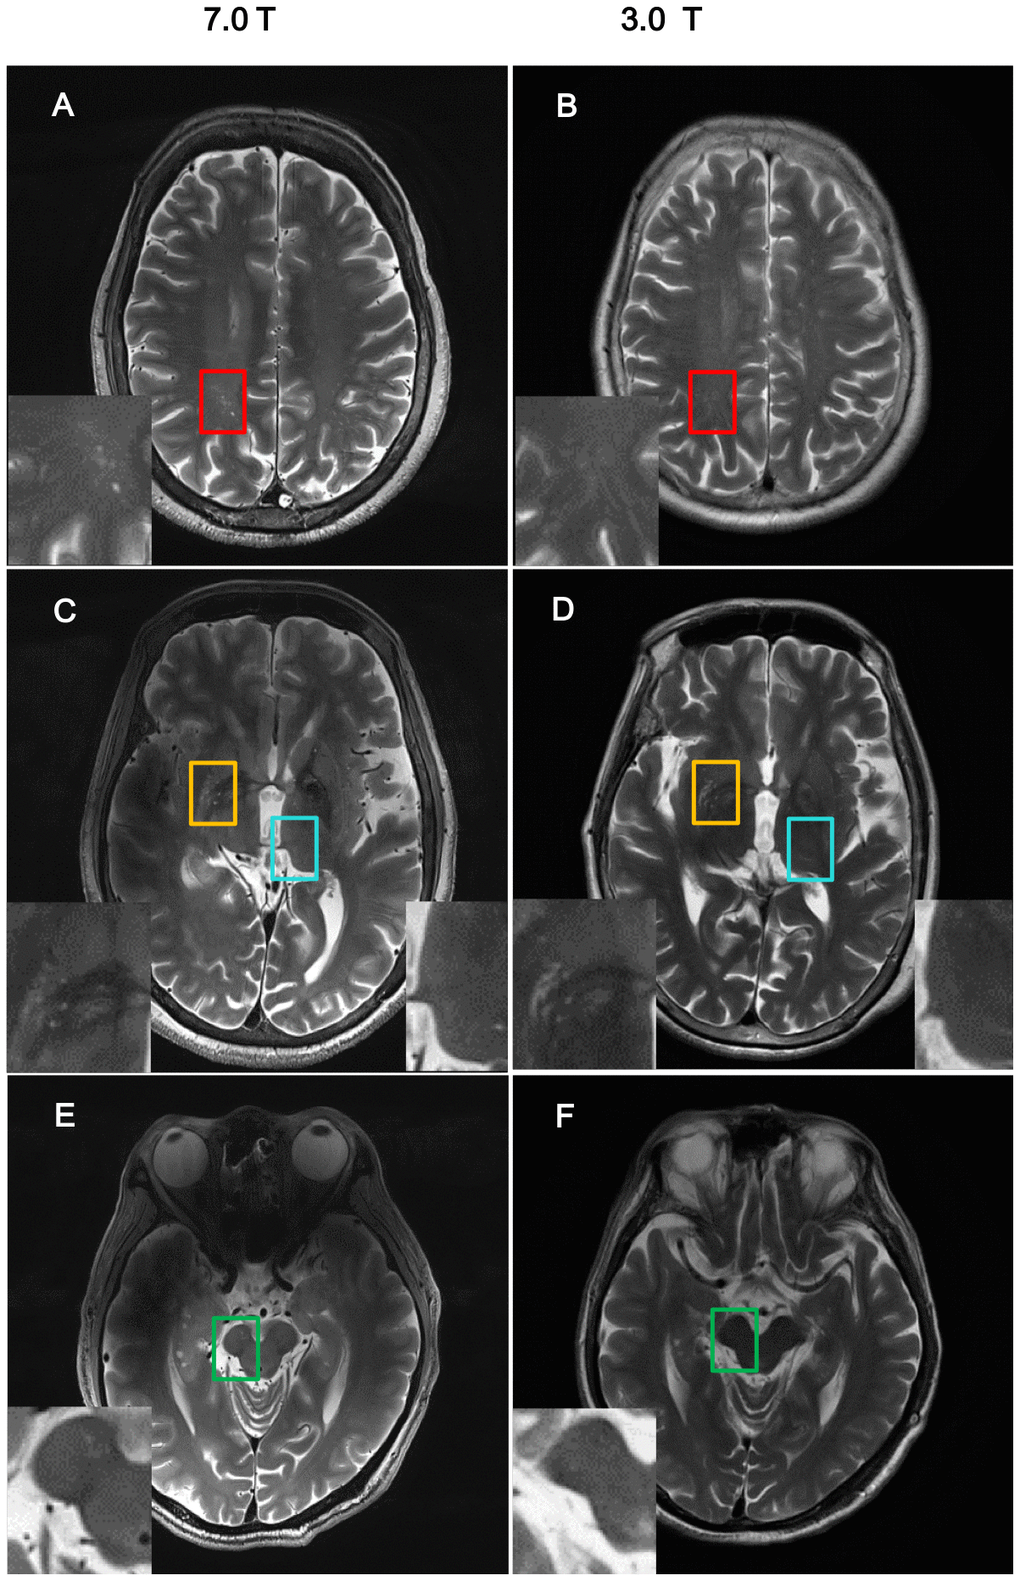
Figure 1.Comparison of imaging resolution between 7T and 3T MRI for nPVS. Example of comparisons of resolution of nPVSs on T2 weighted images acquired by 7.0T MRI vs 3.0T MRI on the same study participant. (A, B) Indicate centrum semiovale with red square; (C, D) indicate yellow squares for basal ganglia and blue squares for thalamus; (E, F) is midbrain with green squares. nPVS, normal-sized perivascular space.