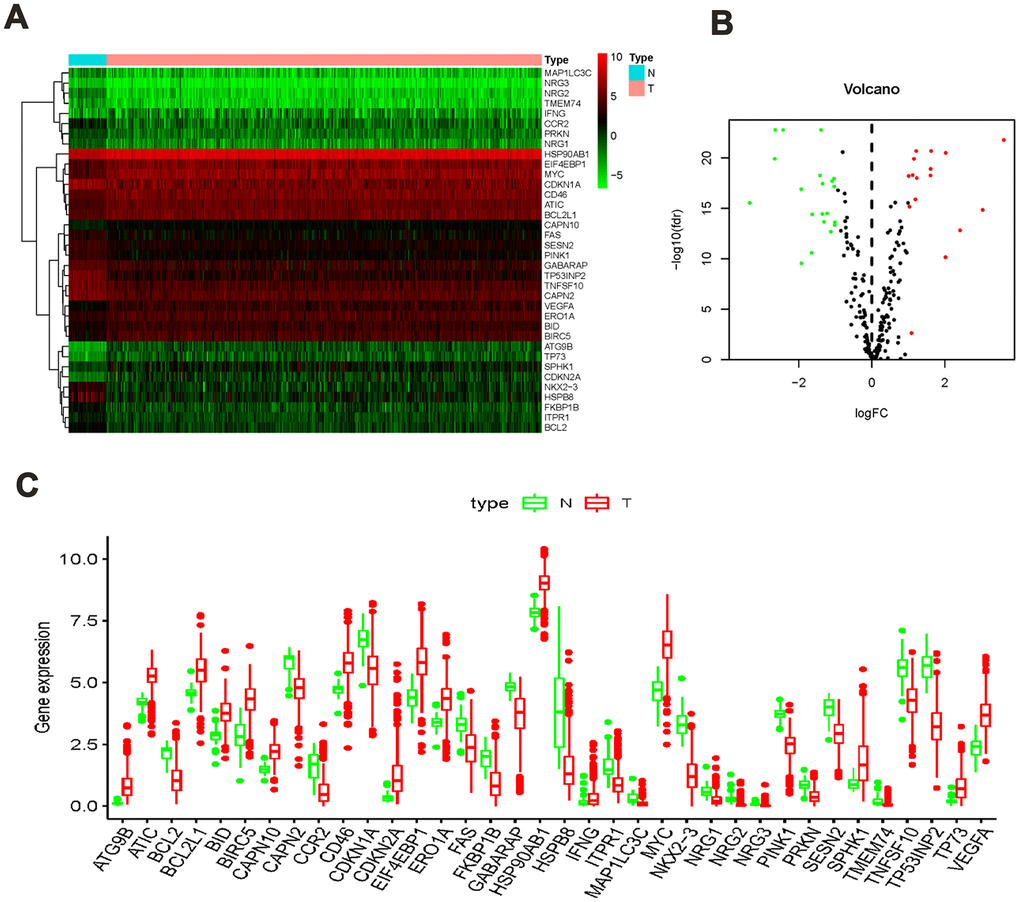
Figure 1.ARGs differentially expressed in colon cancer and normal tissues. (A) Heatmap showed thirty-six differentially expressed genes, with red dots indicating significantly up-regulated genes, green dots indicating significantly down-regulated genes, and black dots indicating no differences gene; (B) the volcanic map of differentially expressed genes; (C) the bar plot of genes in normal and tumor tissues. Red and green indicate tumor tissues and normal tissues.