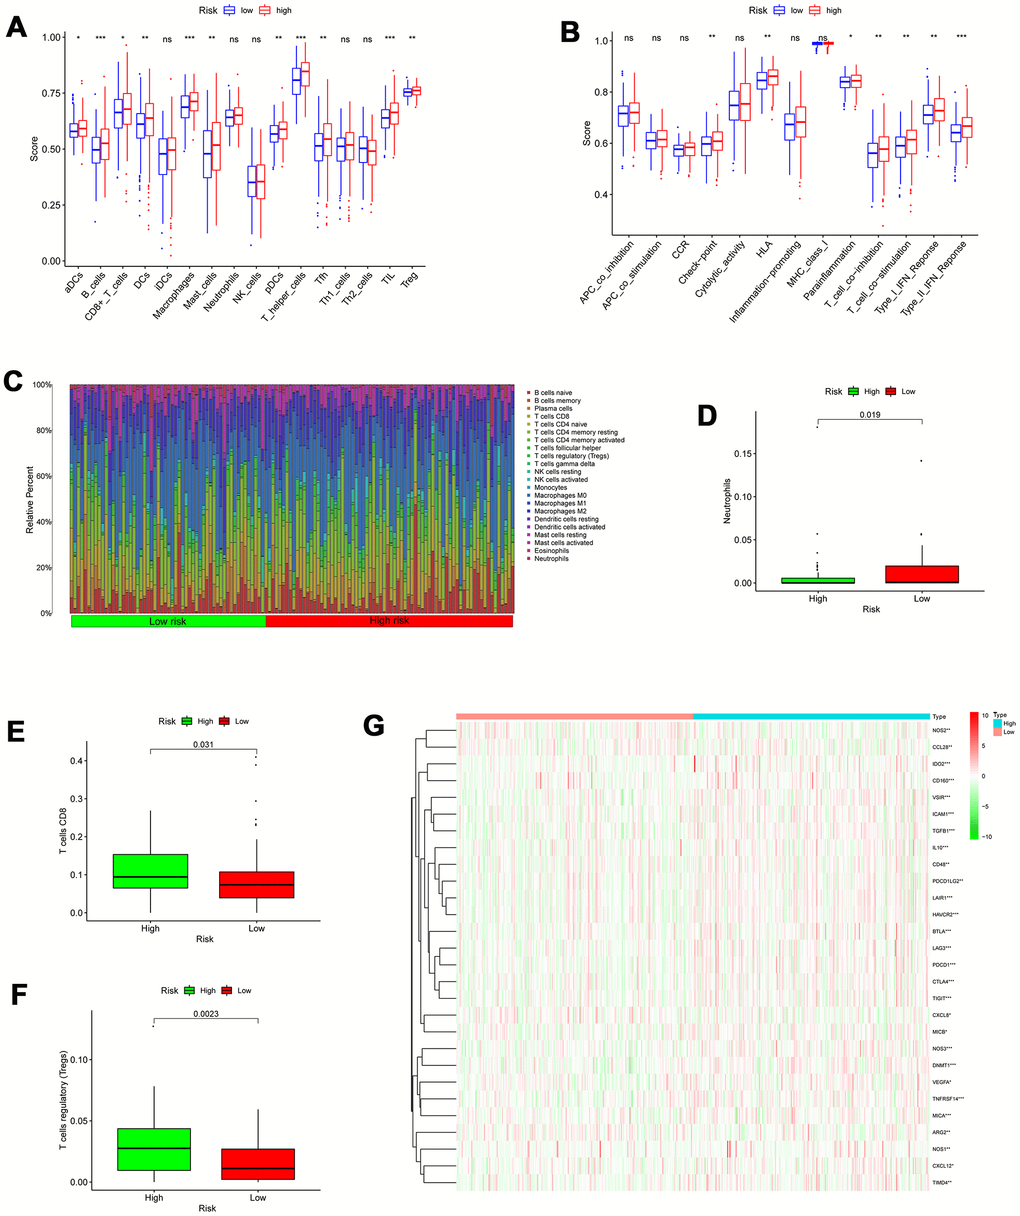
Figure 10.Correlation between the risk signature and immune cell infiltration. (A) Comparison of the infiltration of 16 immune cells between the different risk-groups. (B) Comparison of 13 immune-related functions between the different risk-groups. (C) The proportion of immune infiltration levels between the different risk-groups. (D–F) Box plots showing significantly different immune cells between the different risk-groups. (G) Heatmap of related negative genes involved in the regulation of the Cancer-Immunity Cycle between the different risk-groups; *p < 0.05; **p < 0.01; ***p < 0.001.