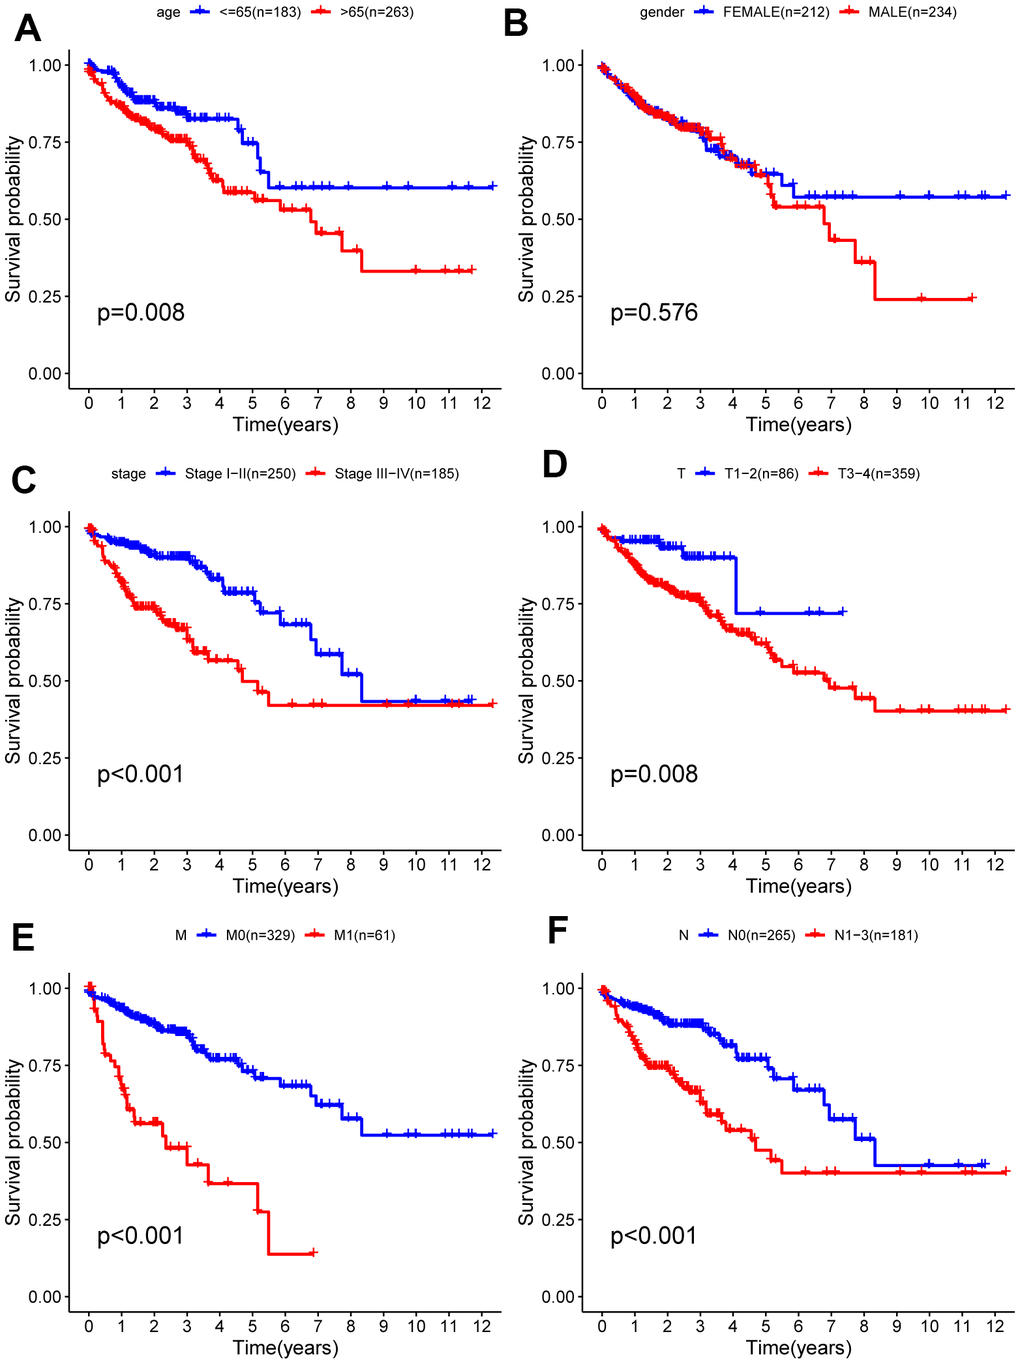
Figure 6.Kaplan-Meier survival analysis of clinical features and survival rate. Clinical features included (A) age, (B) gender, (C) stage (D) T, (E) M, (F) N.
Figure 6 — Development and validation of prognostic model based on the analysis of autophagy-related genes in colon cancer | Aging