Submit an Article
Navigate
Home
Editorial Board
Editorial Policies
Current Volume
Archive
Scientific Integrity
Publication Ethics Statements
Interviews with Outstanding Authors
Newsroom
Sponsored Conferences
Podcast
Contact
Special Collections
Submit an Article
Online ISSN: 1945-4589
Research Paper
|
Volume 13, Issue 15
|
pp. 19108–19126
Features of age-related response to sleep deprivation:
in vivo
experimental studies
Back to article
Figure 2
(2 of 9)
−
100%
+
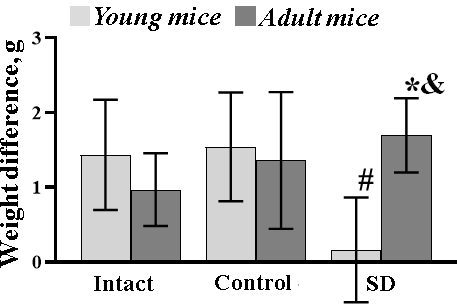
Figure 2.
The weight difference of female C57BL/6 mice between the start and the end of sleep deprivation modelling.
*- versus “Intact”, # - versus “Control”, p≤0.05, the Wilcoxon T-test.