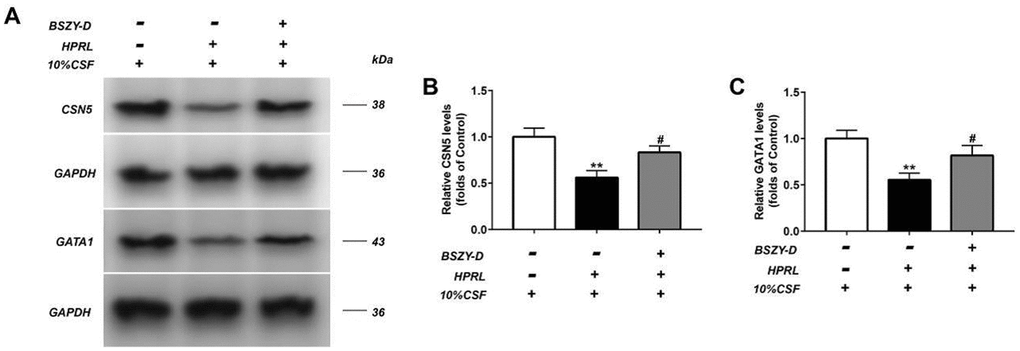
Figure 6.The levels of CSN5 and GATA1 in GT1-7 were detected by western blot assay, and representative bands were shown in (A). The levels of CSN5 (B) and GATA1 (C) were normalized to control. The results were presented as mean ± SD (n = 3).**p < 0.01 vs. Control group, #p < 0.05, ##p < 0.01 vs. HPRL group.