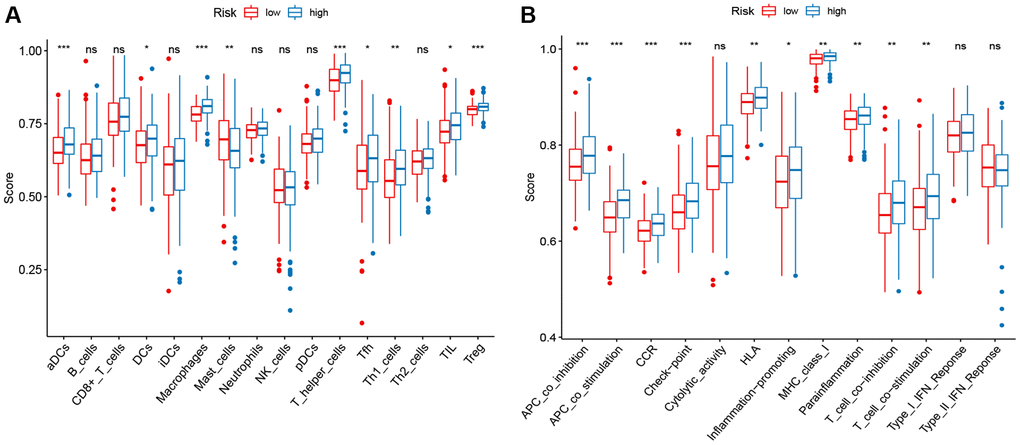
Figure 5.ssGSEA scores in high-risk and low-risk patients in the TCGA set. The scores of 16 immune cells (A) and 13 immune-related functions (B) are displayed in boxplots.
Figure 5 — Identification and validation of a ferroptosis-related gene signature predictive of prognosis in breast cancer | Aging