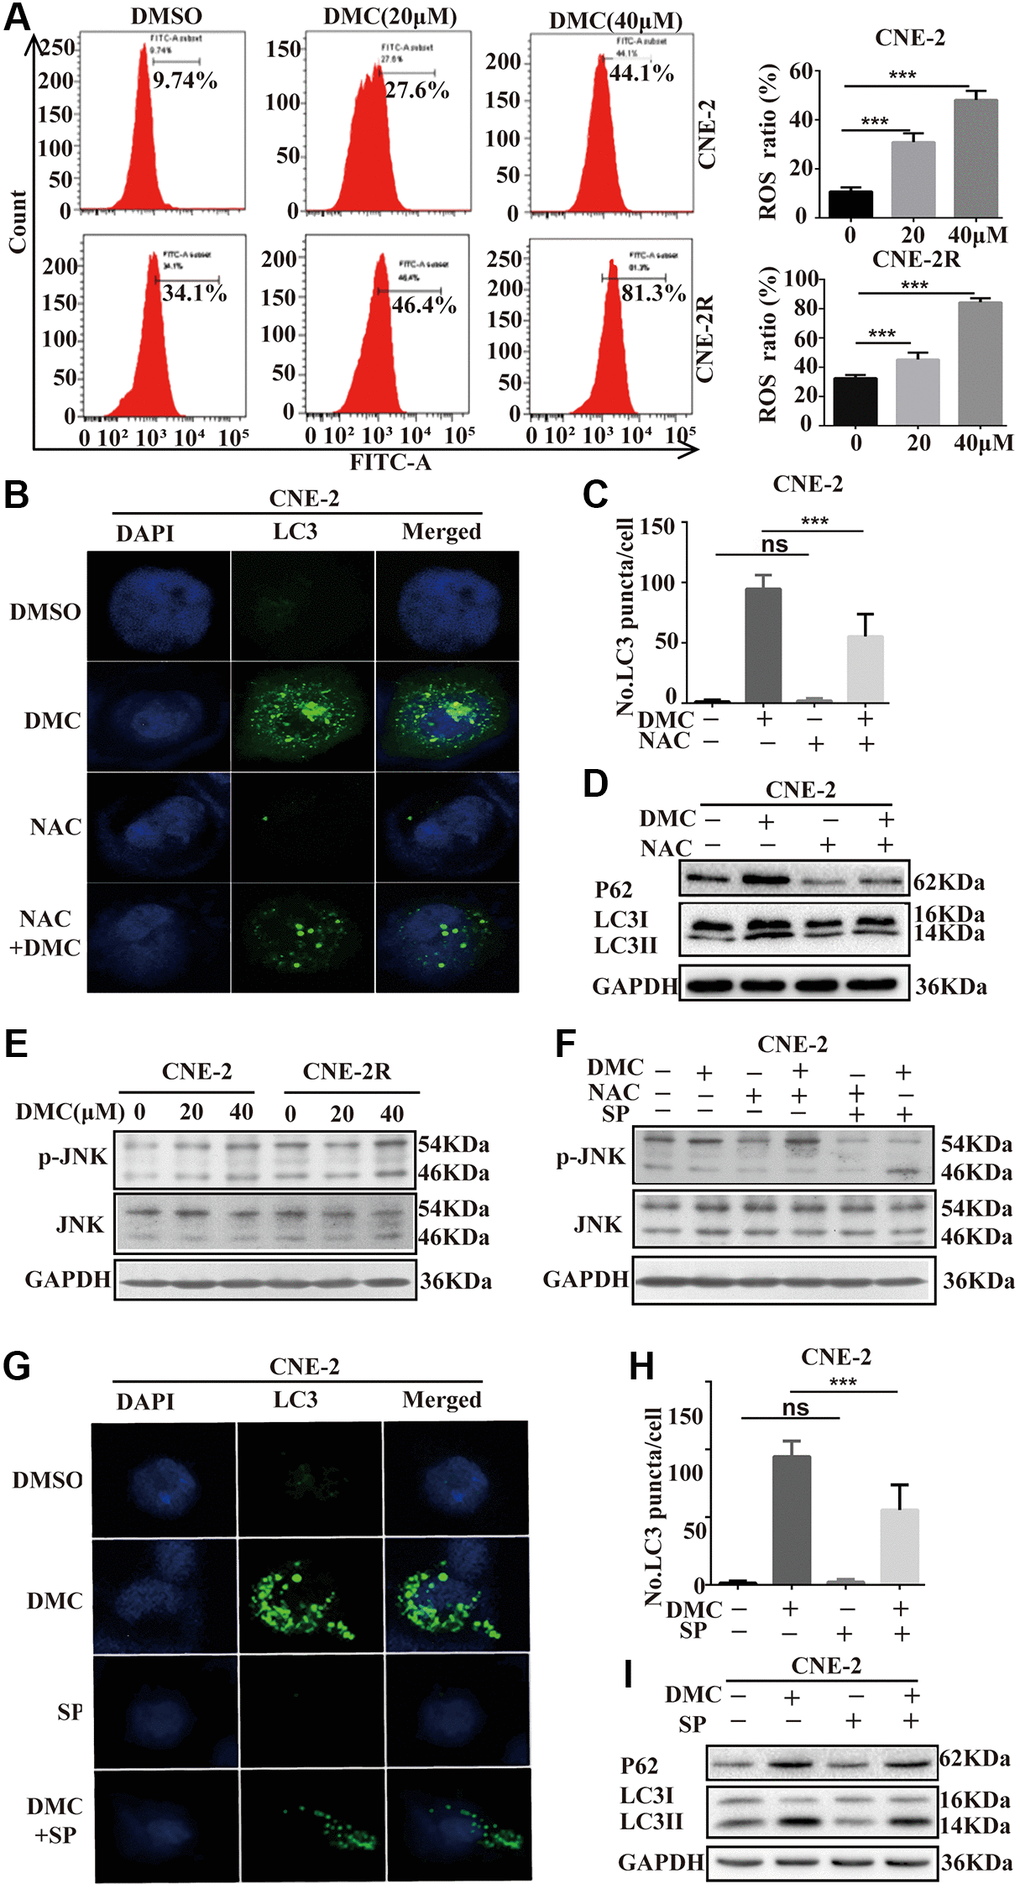
Figure 4.DMC-induced autophagy is mediated through activating ROS/JNK axis in NPC cells. (A) CNE-2 and CNE-2R cells were treated with 20, 40 μM DMC or 0.1% DMSO for 24 h, and then the ROS level was measured and analyzed by flow cytometry. Statistical analysis histogram of the ROS positive percentage. (B, C) Representative images of LC3-labelled green fluorescence puncta in CNE-2 cells after NAC (5 mM) pretreatment for 4 h. Scale bar: 10 μm. Nuclei were stained with DAPI. Histogram of LC3-labelled green fluorescence puncta per cell and over 30 cells were counted in each group. (D) Western blotting analysis of LC3-I, LC3-II and P62 levels in CNE-2 cells as Figure 4B, GAPDH was used as a loading control. (E) Western blotting analysis of of p-JNK and JNK protein expressions in CNE-2 and CNE-2R cells treated with 20, 40 μM DMC or 0.1% DMSO for 24 h. (F) Western blotting analysis of of p-JNK and JNK protein expressions in CNE-2 cells treated with 0.1% DMSO or 20 μM DMC for 24 h in the absence or presence of NAC (5 mM) pretreatment for 4 h and SP600125 (30 μM) pretreatment for 1 h. (G, H) Representative images of LC3-labelled green fluorescence puncta in CNE-2 cells after SP600125 (30 μM) pretreatment for 1 h. Scale bar: 10 μm. Nuclei were stained with DAPI. Histogram of LC3-labelled green fluorescence puncta per cell and over 30 cells were counted in each group. (I) Western blotting analysis of LC3-I, LC3-II and P62 protein expressions in CNE-2 cells as Figure 4G. **P < 0.01 and ***P < 0.001, significantly different compared with control group.