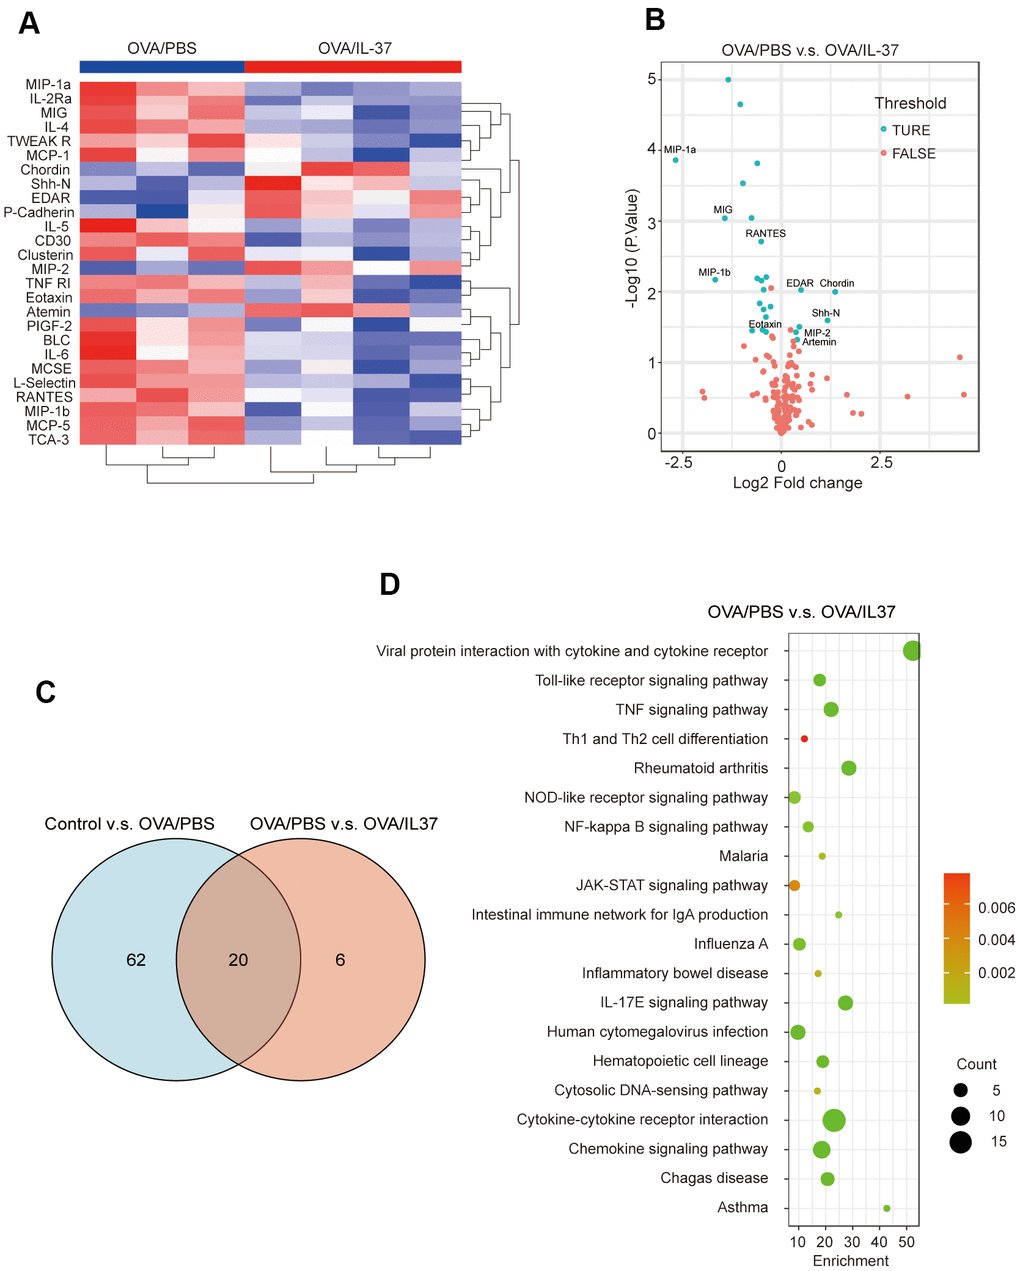
Figure 5.Visualization of cytokine antibody array analysis. (A) Clustering heatmap. Red represents OVA/IL-37 group, blue represents OVA/PBS group. (B) Volcano plot shows 26 differentially expressed proteins (DEPs)(blue dot) between OVA/PBS and OVA/IL-37, which are defined as those with adjust p value(adj.P.Val) less than 0.05 and foldchange over 1.2 or less than 0.83(absolute LogFC>0.263). Top 10 DEPs have been marked on the picture. (C) There are 20 DEPs result from intersection of Control v.s. OVA/PBS and OVA/PBS v.s. OVA/IL-37. (D) Protein function annotation KEGG pathway (OVA/PBS v.s. OVA/IL-37).