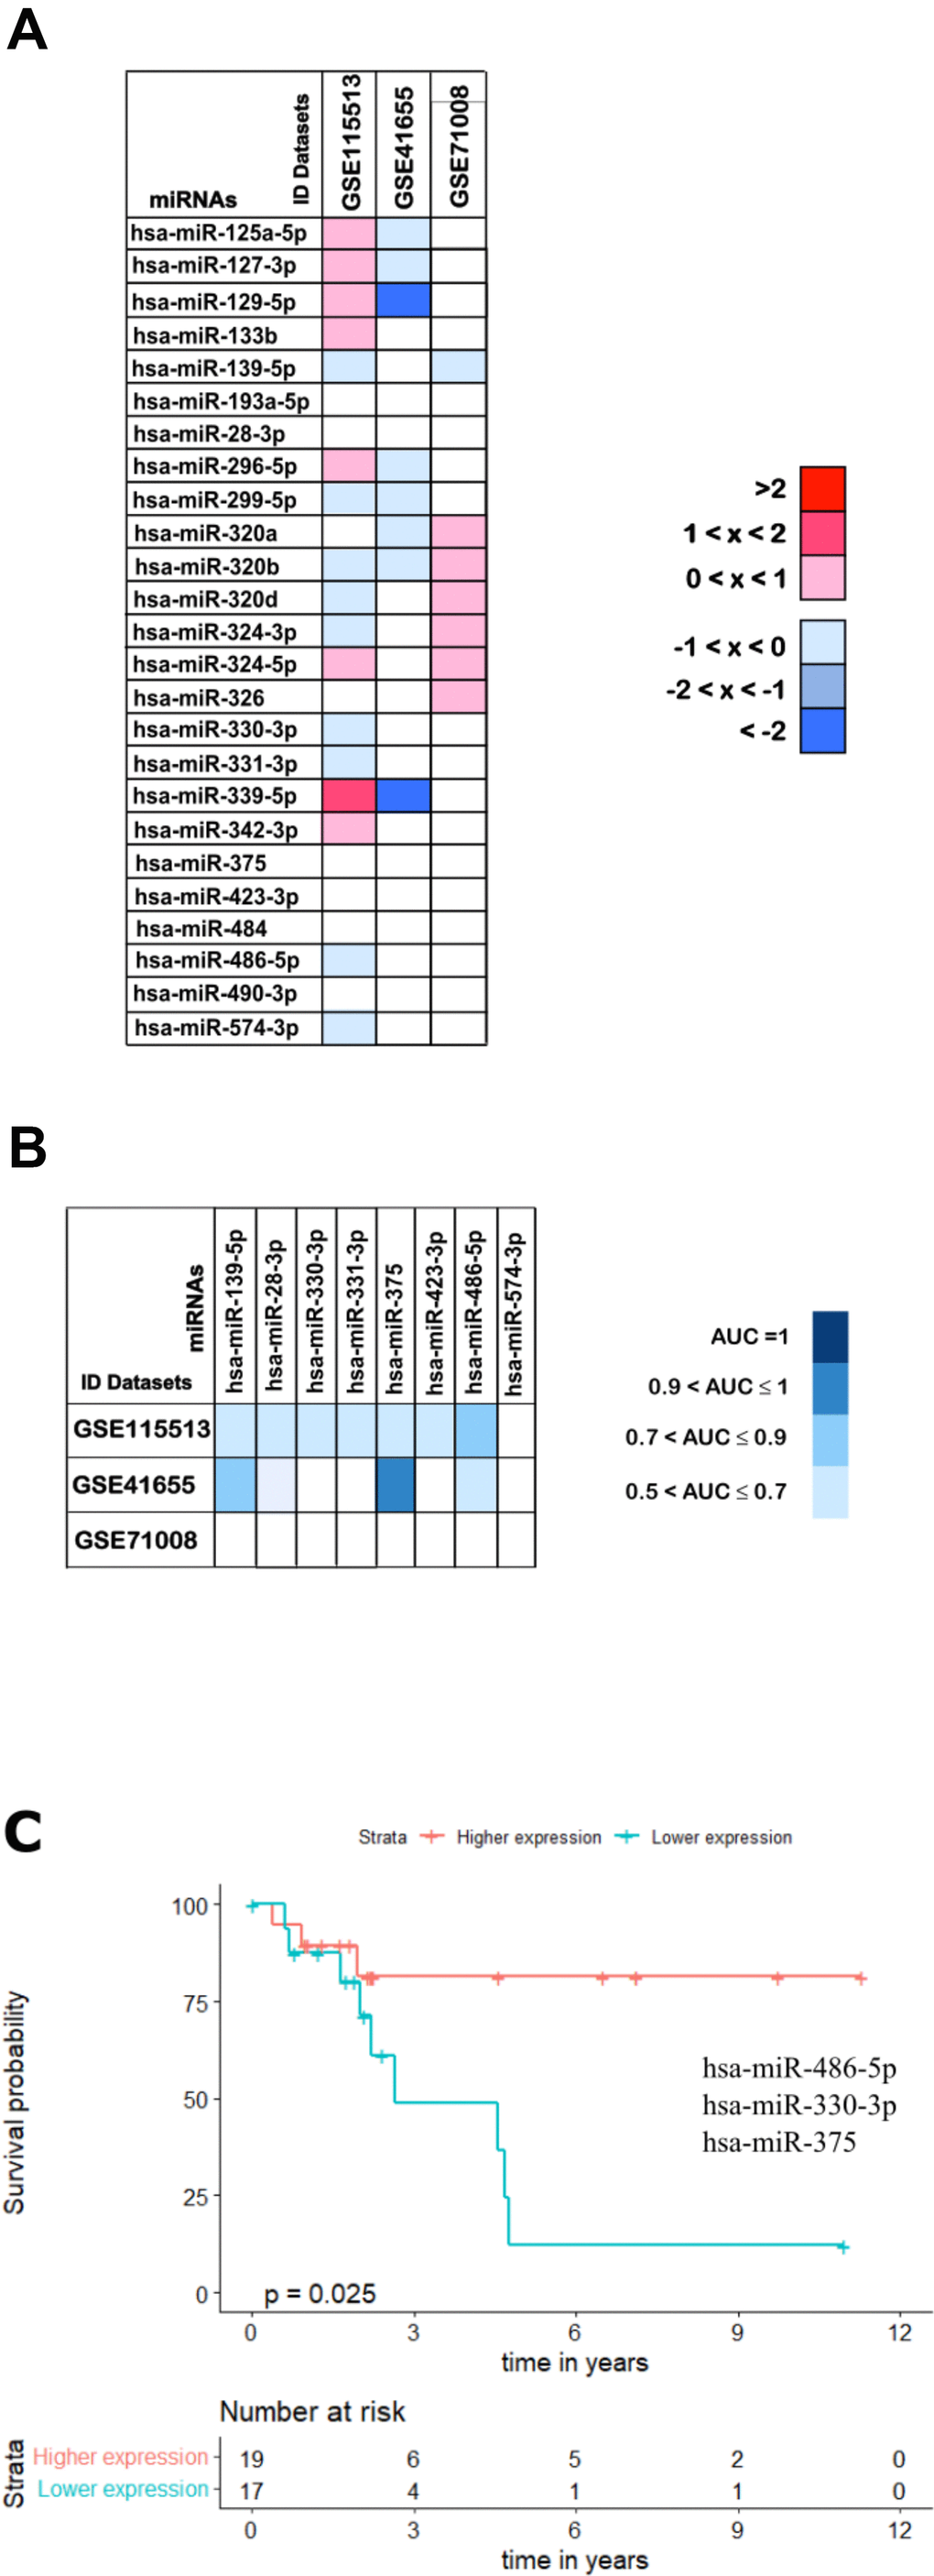
Figure 11.Validation analysis for the 25 downregulated miRNAs in CRC. (A) The log2(FC) values calculated for each dataset are reported with red scale boxes for upregulated miRNAs and blue scale boxes for the downregulated miRNAs. White boxes represent the inexistence of the miRNA on the dataset. (B) The miRNAs AUC values in each of the datasets GSE115513, GSE41655 and GSE71008 are reported as blue scale boxes. MiRNAs with AUC = 1 were considered perfect diagnostic biomarkers, 0.9 < AUC < 1 highly accurate, 0.7 < AUC ≤ 0.9 moderately accurate and 0.5 < AUC ≤ 0.7 less accurate [76]. (C) Stage III OS Kaplan-Meier curve based on miR-486-5p - miR-330-3p - miR-375 (p-value = 0.025, Log rank test; HR= 4.01). Time is represented in years. Higher (in red) and Lower (in blue) expression groups represent the group of patients with miRNA expression above and below miRNAs median expression, respectively. Censored data is represented by small plus signs in each group. The number of patients at risk for each group and per time point is shown in the table below each graph. HR, hazard ratio.