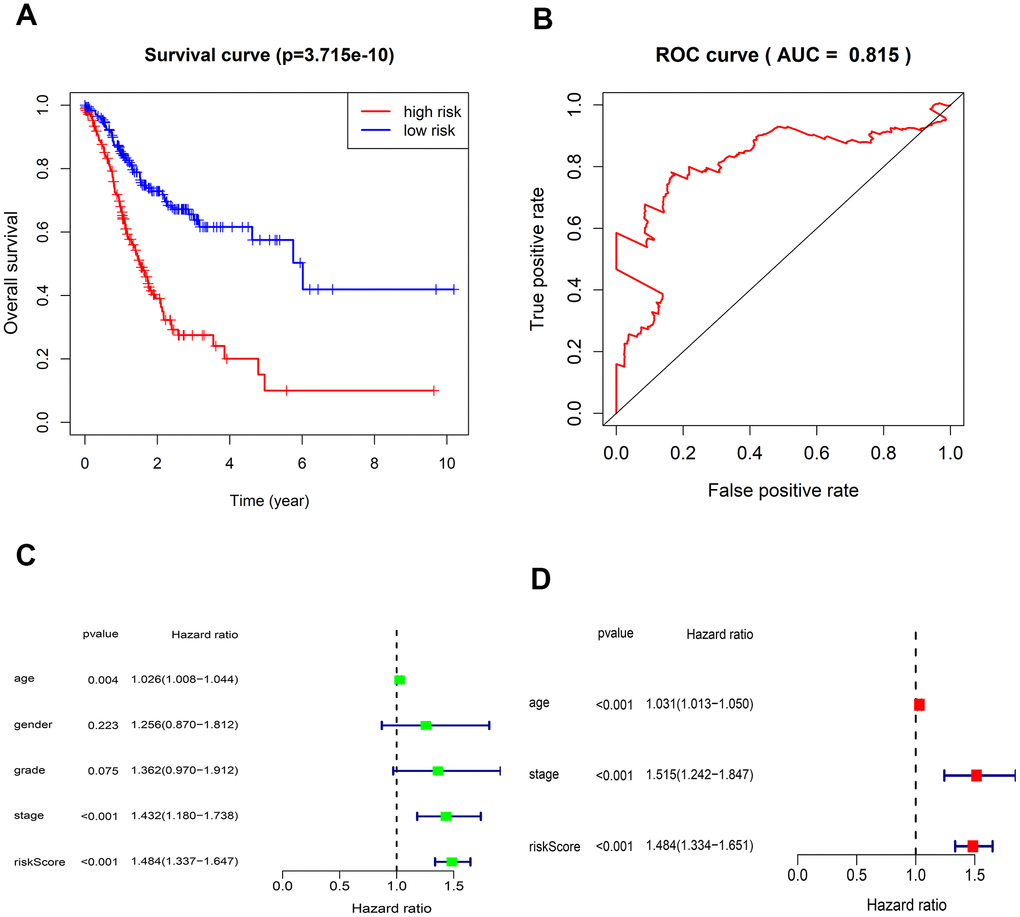
Figure 2.Kaplan-Meier survival and ROC curves for the five-lncRNA in TCGA. (A) The different OS between the high- and low-risk groups were determined by the log-rank test (p = 3.715e-10). (B) ROC curve for predicting 5-year survival with an AUC of 0.815. (C) Univariate Cox analysis evaluated the independent prognostic value of traditional clinical features and risk scores for OS in GC from TCGA. (D) Multivariate Cox analysis evaluates the independent prognostic value of traditional clinical features and risk scores for OS in GC.