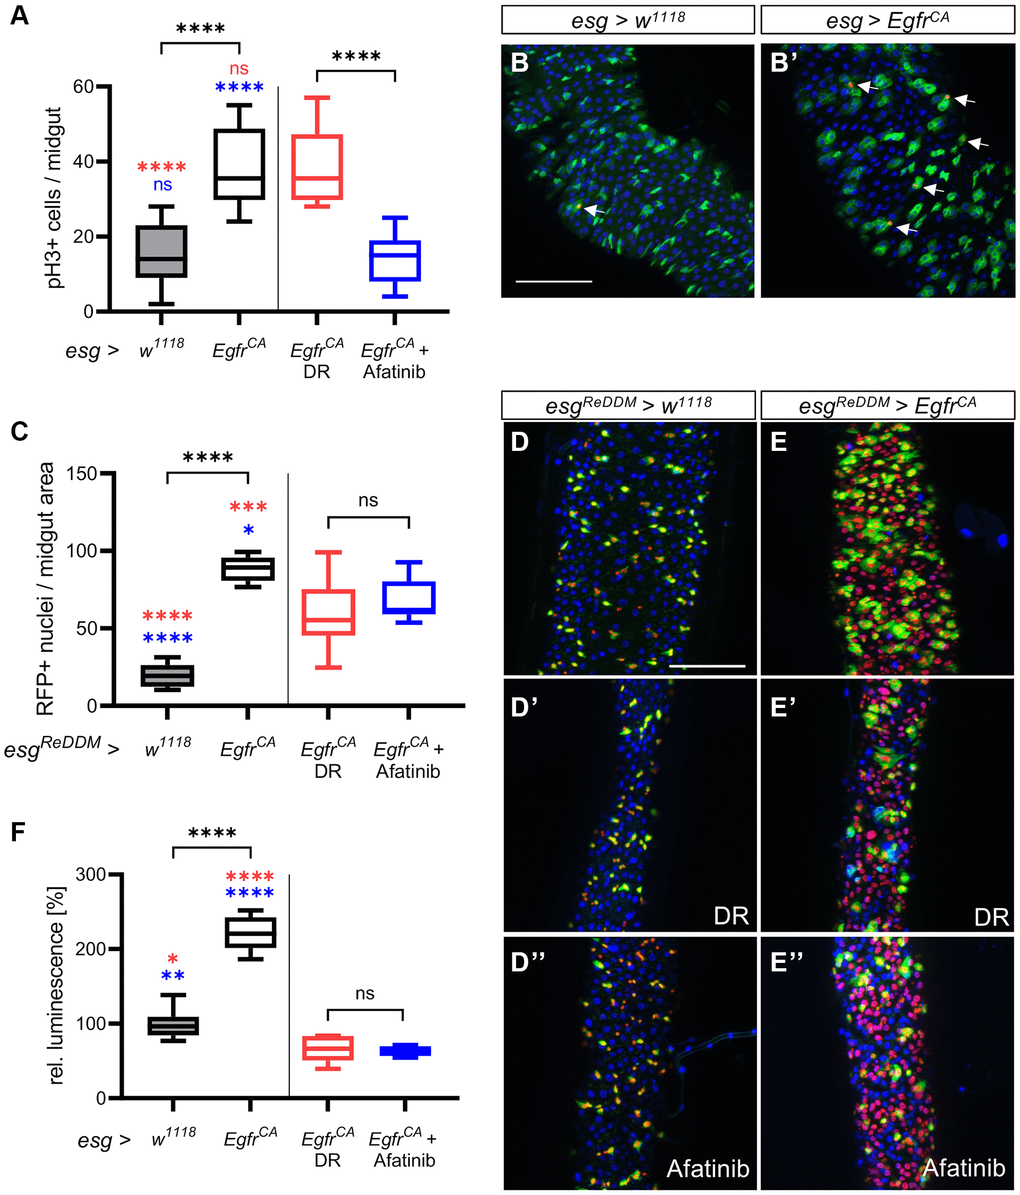
Figure 3.Detailed phenotypic analysis of the effects of DR and afatinib. Control animals (esg > w1118) and animals with an Egfr-induced over-proliferation (esg > EgfrCA) of intestinal stem cells and enteroblasts (esg+ cells) were either exposed to dietary restriction (DR) or treated with afatinib at induction. (A) Midguts were stained with an antibody for phospho-histone 3 to mark cells undergoing mitosis after 5 days. Ph3-positive stained cells in the whole intestine were counted. n = 9–11. (B, B’) Midguts of control animals (esg > w1118) and animals with Egfr-induced over-proliferation (esg > EgfrCA); esg+ cells are marked with GFP and mitotically active cells are stained red with an anti-pH3 antibody (indicated by the white arrows). (C) Quantification of cells that are RFP-positive through induction of the ReDDM system after 5 days. n = 10–11. (D–E) Control animals (esgReDDM > w1118) and animals with an Egfr-induced over-proliferation (esgReDDM > EgfrCA) in esg+ cells of the midgut were either exposed to DR at induction (D’, E’) or treated with afatinib (D”, E”). Esg+ cells are shown in green, RFP-positive progeny are shown in red, and nuclei are shown with blue DAPI staining. (F) Luciferase was quantified in whole animals as a measure of the over-proliferation phenotype after 15 days of induction. n = 5–7. Statistical significance was tested by one-way ANOVA and the Tukey test. Significances are marked with lines or the corresponding color. ns = not significant, * = p < 0.05, ** = p < 0.01, *** = p < 0.001, **** = p < 0.0001. Scale bar: 100 μm.