Submit an Article
Navigate
Home
Editorial Board
Editorial Policies
Current Volume
Archive
Scientific Integrity
Publication Ethics Statements
Interviews with Outstanding Authors
Newsroom
Sponsored Conferences
Podcast
Contact
Special Collections
Submit an Article
Online ISSN: 1945-4589
Research Paper
|
Volume 13, Issue 22
|
pp. 24655–24674
Identification and replication of novel genetic variants of ABO gene to reduce the incidence of diseases and promote longevity by modulating lipid homeostasis
Back to article
Figure 3
(3 of 4)
−
100%
+
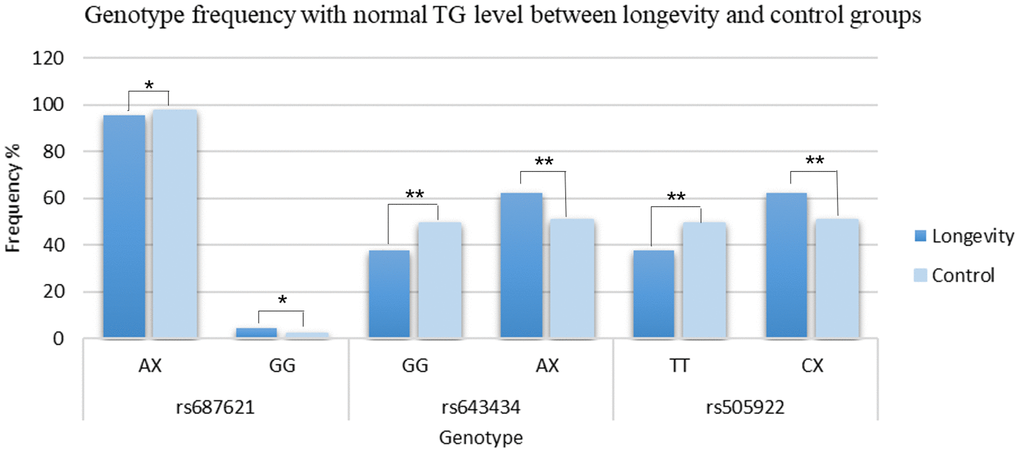
Figure 3.
Comparison of genotype frequencies between the longevity and the control group.
*
p
≤0.05; **
p
≤0.01.