Submit an Article
Navigate
Home
Editorial Board
Editorial Policies
Current Volume
Archive
Scientific Integrity
Publication Ethics Statements
Interviews with Outstanding Authors
Newsroom
Sponsored Conferences
Podcast
Contact
Special Collections
Submit an Article
Online ISSN: 1945-4589
Research Paper
|
Volume 13, Issue 23
|
pp. 25106–25137
Landscape of the oncogenic role of fatty acid synthase in human tumors
Back to article
Figure 5
(5 of 19)
−
100%
+
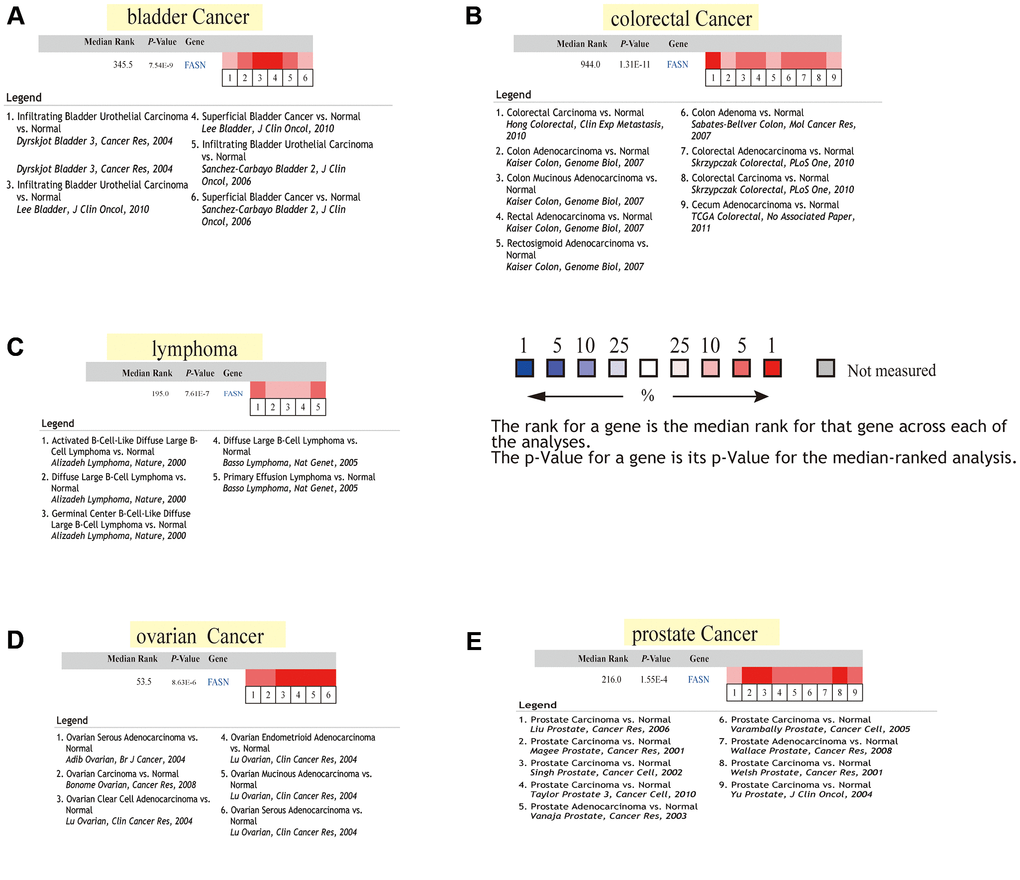
Figure 5.
Pooled FASN analysis using normal and tumor tissues.
(
A
) Lung cancer; (
B
) kidney cancer; (
C
) colorectal cancer; (
D
) lymphoma; and (
E
) myeloma.