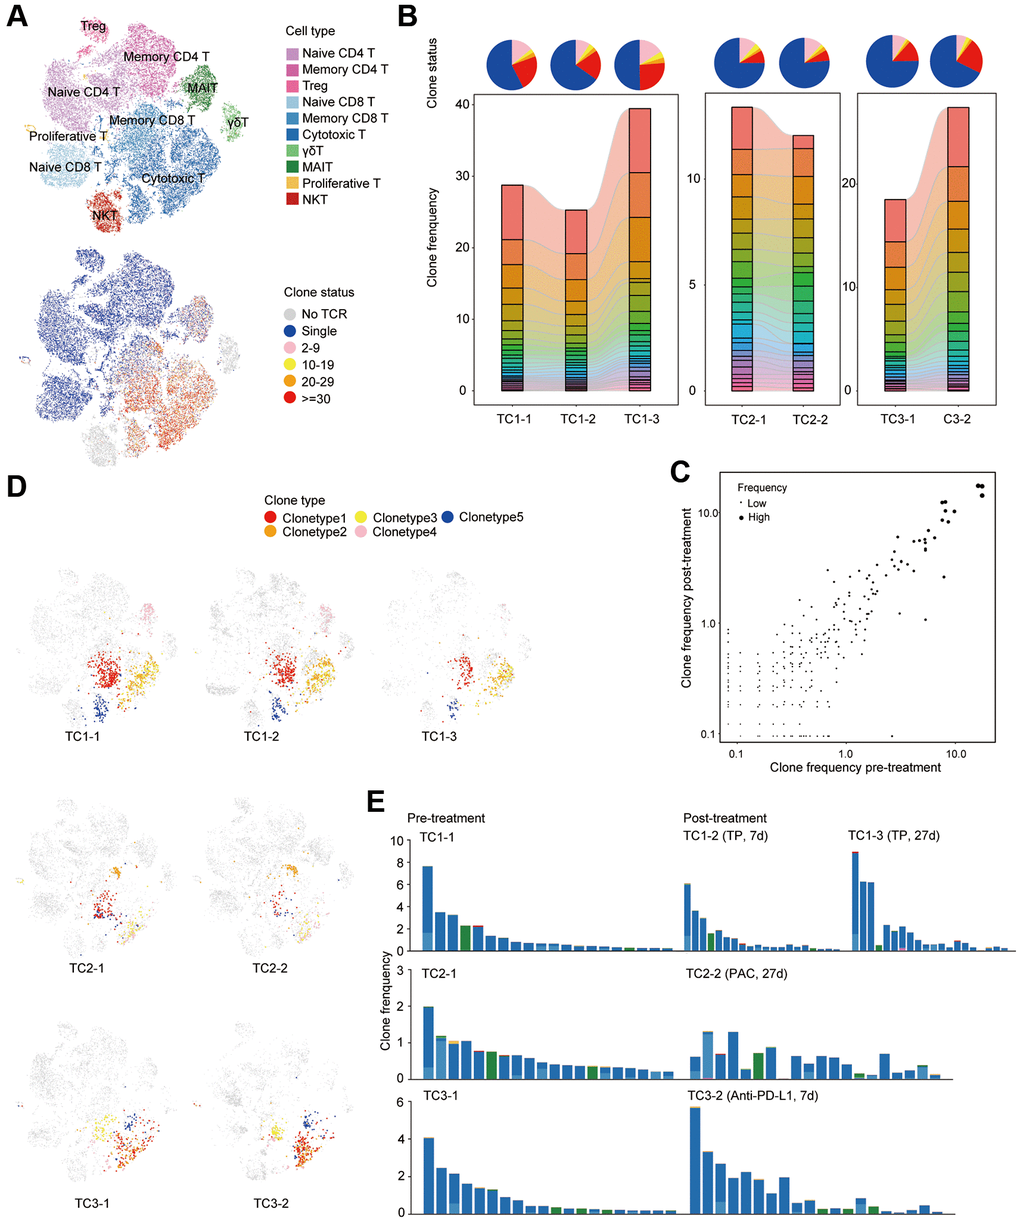
Figure 4.Clonal dynamics of T cells pre- and post-treatment in COVID19 patients with tumor. (A) t-SNE plot of T cells colored by cell types (top) and clone status (bottom). (B) The proportion of each clone status (top) and clone type (bottom). Bars are colored by the top 20 most abundant clones in each patient at different time points. (C) Scatterplots comparing TCR clone frequencies pre- and post-treatment. Shown are amplified clones (n > 1). (D) t-SNE plot of single cells colored by selected TCR clones. Shown are the top 5 most abundant clones before treatment in each patient at different time point. (E) Phenotypes of single cells belonging to the same TCR clone. Shown are the top 20 most abundant clones before treatment in each patient at different time point.