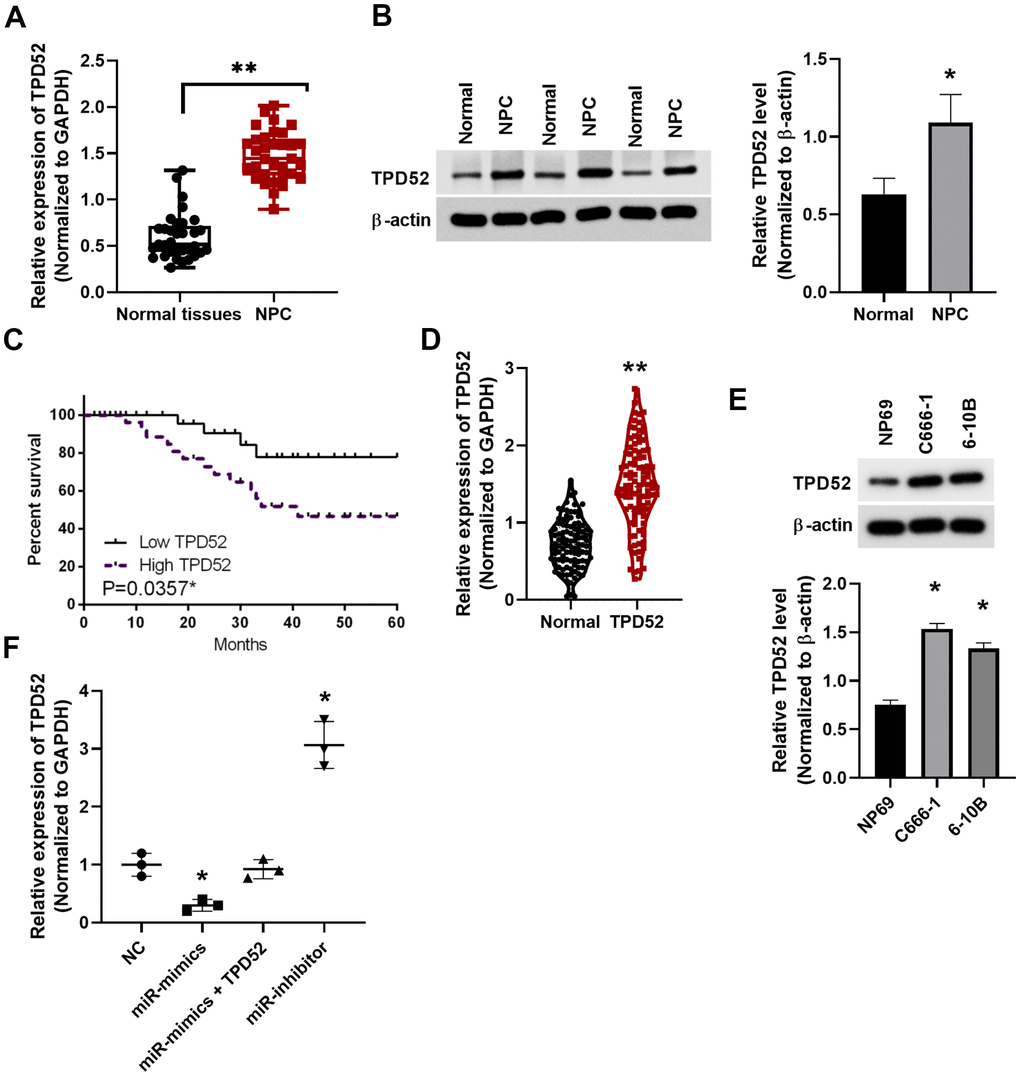
Figure 5.Upregulation of TPD52 in NPC patient tissue and cell lines. (A) TPD52 expression was analyzed in NPC tissues via qRT-PCR. N=33. (B) TPD52 protein levels were analyzed by western blot and normalized to β-actin (N=10). (C) Low TPD52 expression predicted good prognosis in NPC patients. (D) High TPD52 expression in NPC was found in public available study cohorts in TCGA database (N=102). (E) High TPD52 protein levels in NPC cell lines (N=3). (F) TPD52 expression was measured in C666-1 cells transfected with miR-212 mimics and inhibitor (N=3). *p <0.05, **p <0.01.