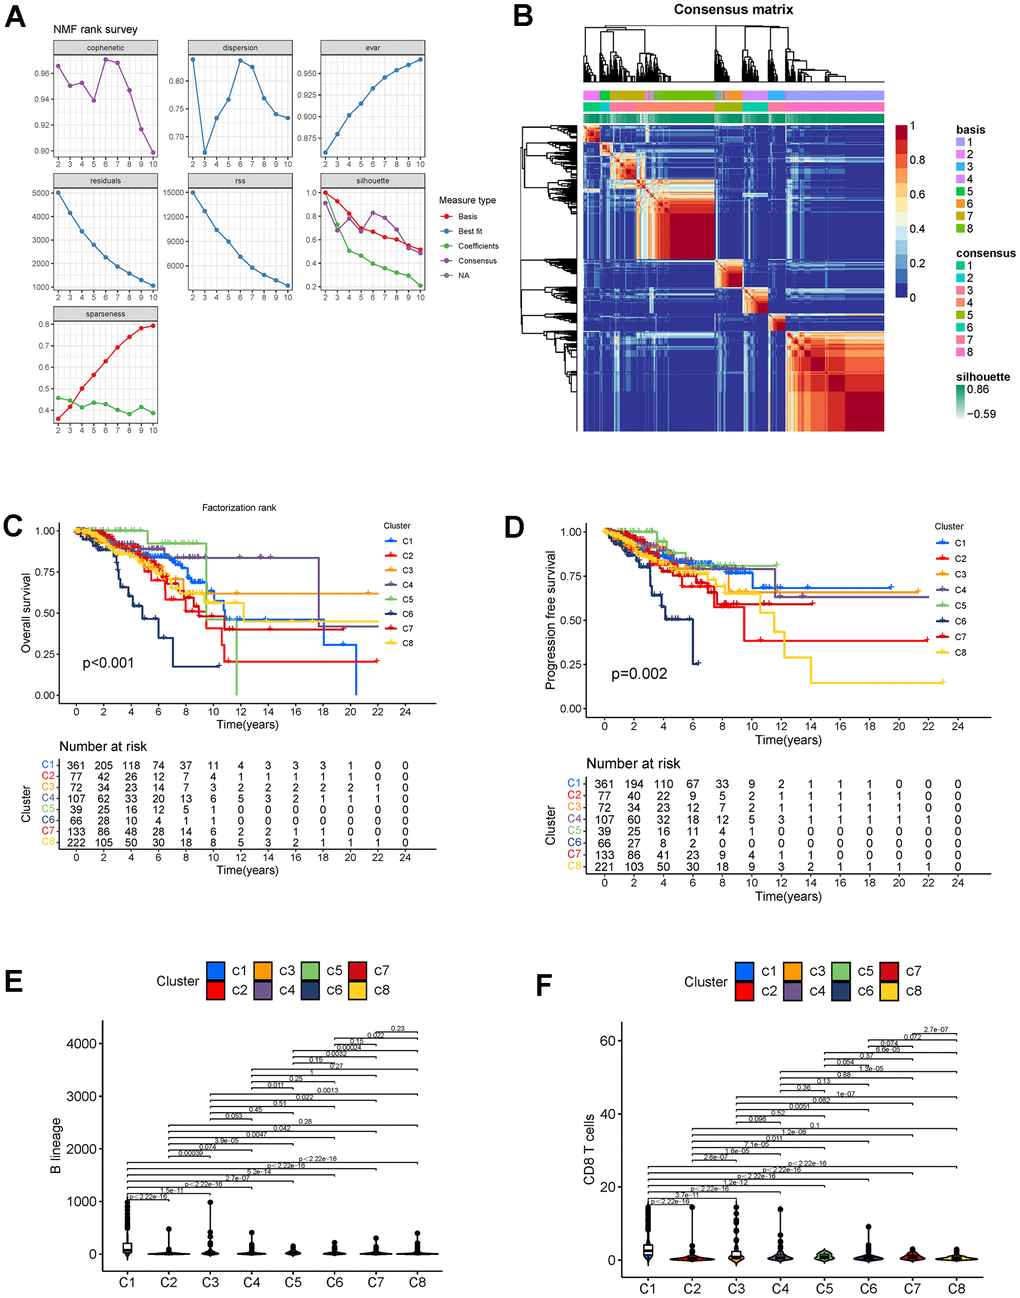
Figure 4.(A) Factorization rank for 2–10 clusters. (B) Heatmap of the gene expression of eight clusters. (C, D) K-M curves for OS and PFS in different subtypes. (E) B lineage cell infiltration in different subtypes. (F) CD8+ T cell infiltration in different subtypes. Abbreviations: K-M: Kaplan-Meier; OS: overall survival; PFS: progression-free survival.