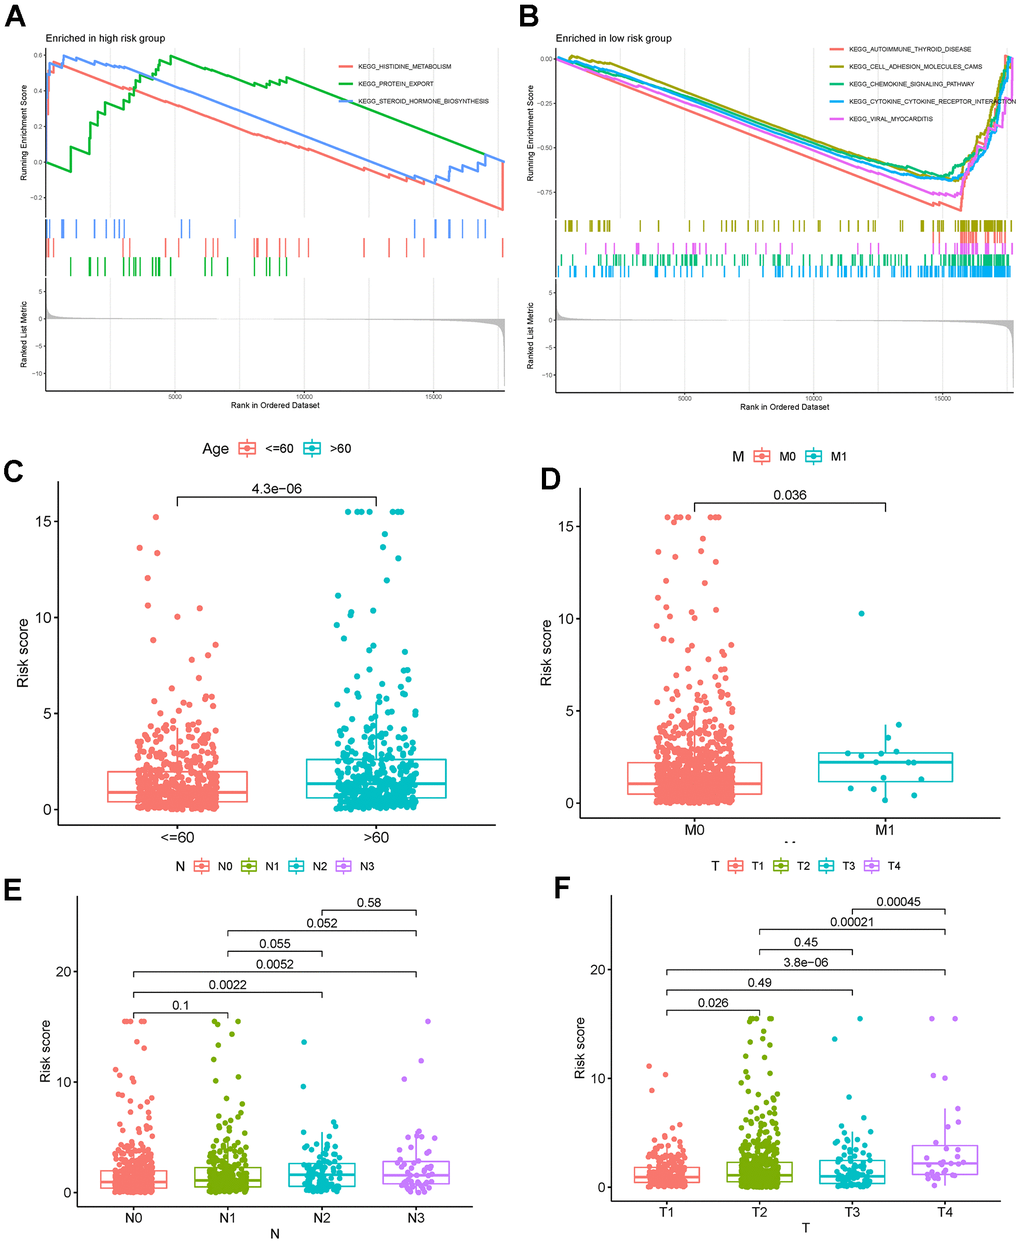
Figure 9.(A, B) GSEA in low- and high-risk breast cancer. (C–F) Correlation analyses of the risk score with age, M stage, N stage, and T stage. Abbreviations: GSEA: gene set enrichment analysis.
Figure 9 — Tumor microenvironment-related multigene prognostic prediction model for breast cancer | Aging