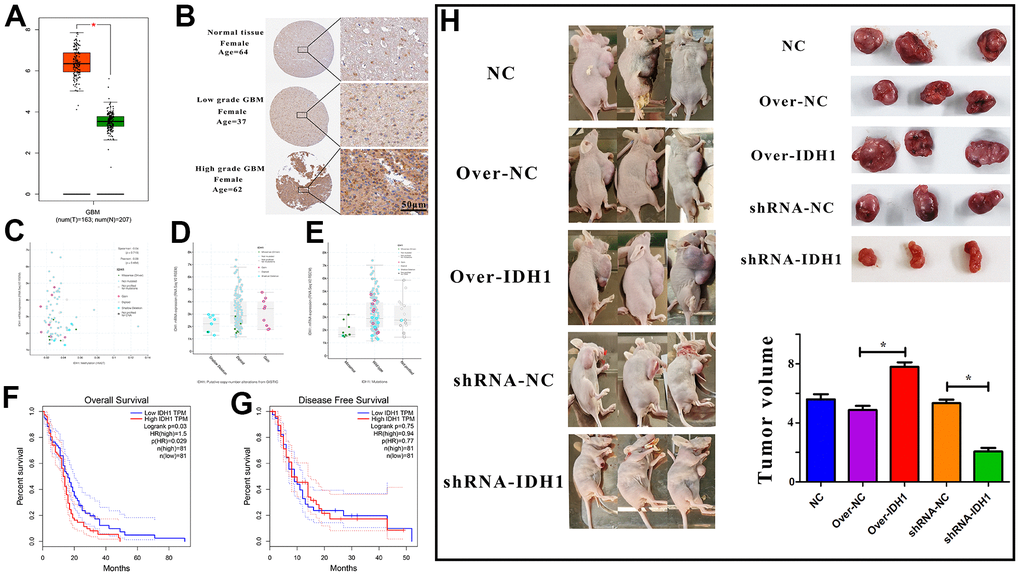
Figure 1.The expression of IDH1 in GBM. (A) The box figure shows the expression of IDH1 in tumor (n=163) and normal tissues (n=207) with error bars. The red box represents tumor samples and the green one represents normal samples. *, p-value≤0.05. (B) The protein level of IDH1 in different GBM grades. The pictures of immunohistochemistry results with different magnifications. (C–E) The scatter and box diagram shows the correlation between IDH1 mRNA level and methylation, copy number and mutation, respectively. The legend and coefficient of association were listed on the right. (F, G) The survivorship curves of OV and DFS with a confidence interval, respectively. The red curve represents samples with a higher level of IDH1. Oppositely, the blue one represents samples with a lower level of IDH1. The related parameters were listed on the right. (H) Representative images of subcutaneous tumors originated from transfected GBM cells and the corresponding statistical results.