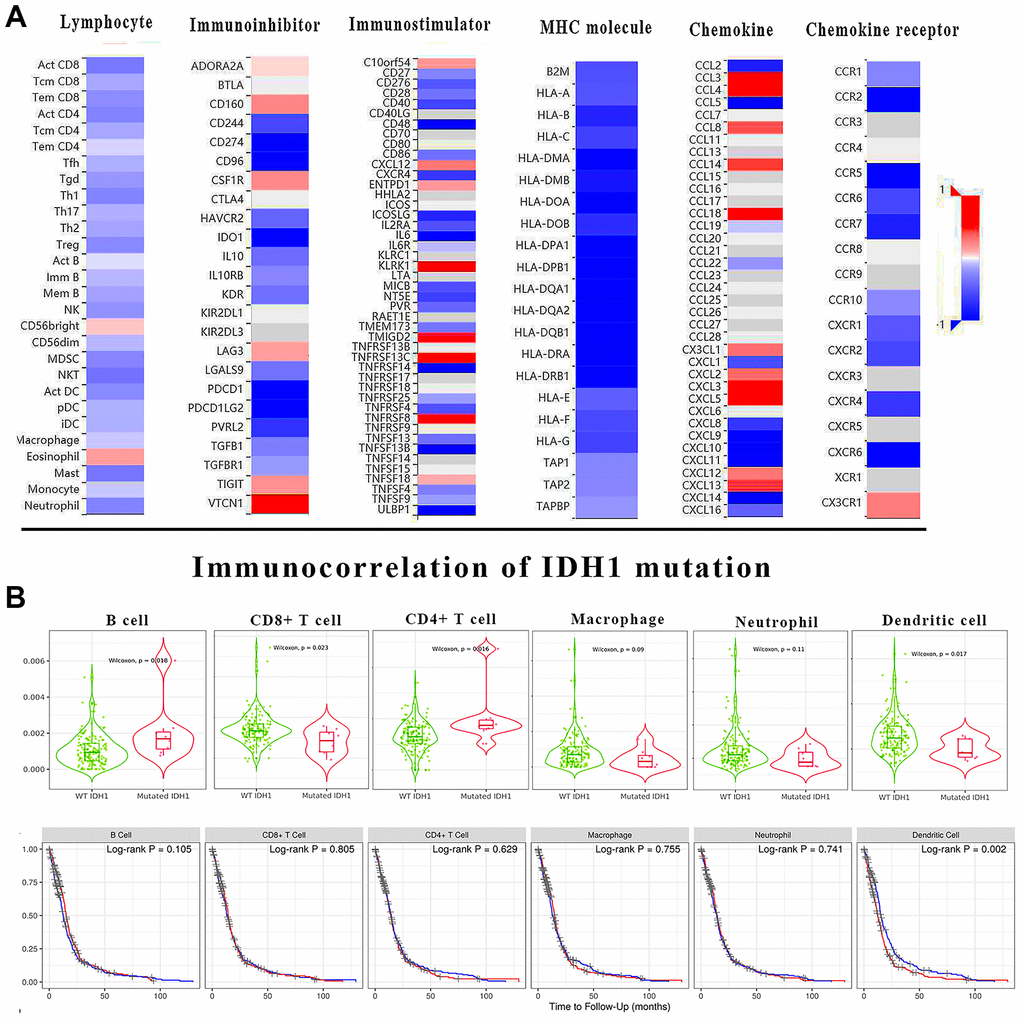
Figure 4.The immune correlation of IDH1 mutation in GBM. (A) The heat map shows the correlation of IDH1 and various immune indexes. The red box represents positive correlation and the blue one represents negative correlation. (B) The violin figures above show the infiltration of main lymphocyte types in wild type or IDH1 mutated samples. The following survivorship curves of OV show the correlation between lymphocyte infiltration and prognosis. The red curves represent the high level of infiltration and the blue ones represent the lower level of infiltration.