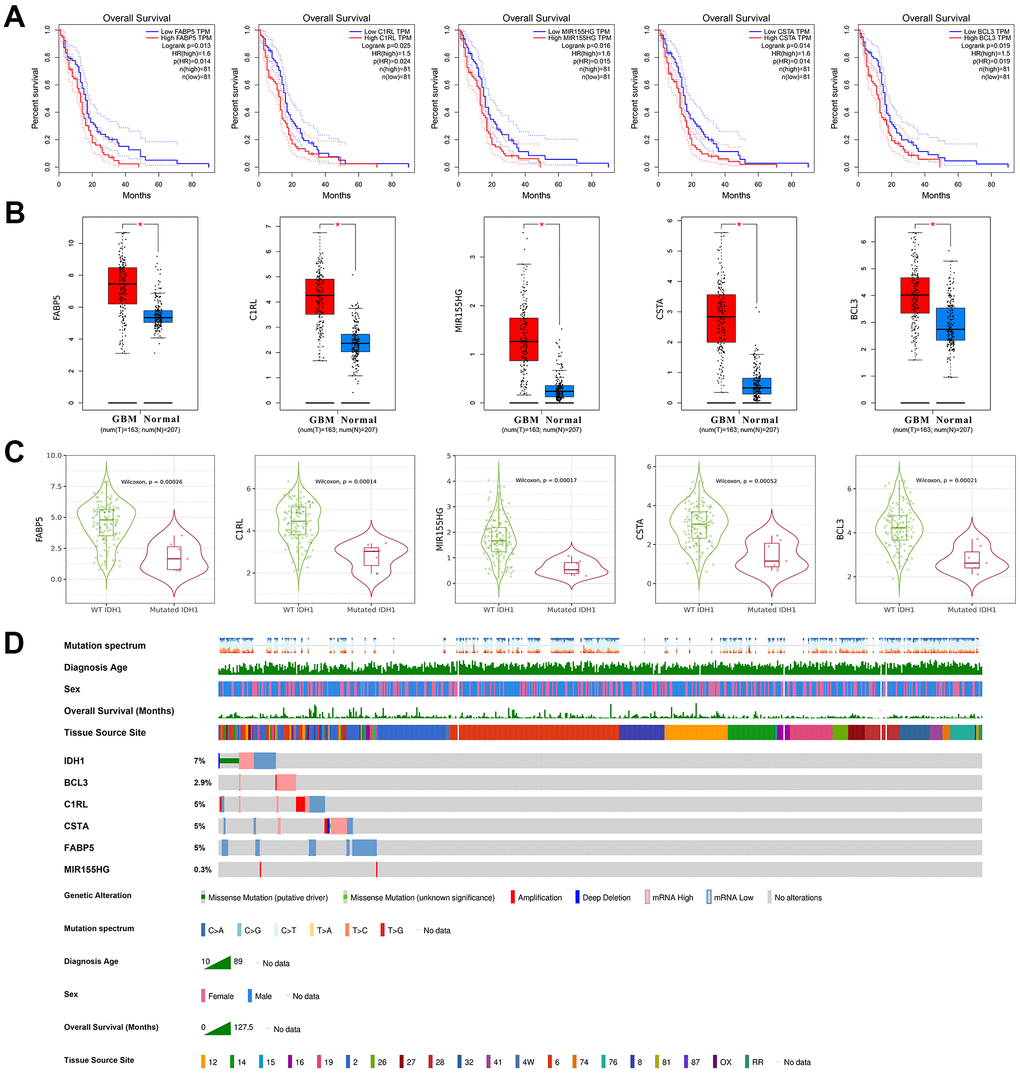
Figure 5.The clinical character of crucial genes. (A) The survivorship curves of OV with confidence interval. The red curve represents samples with a higher level of the crucial gene. Oppositely, the blue one represents samples with a lower level. The related parameters were listed on the right. (B) The box figure shows the expression of genes in tumors (n=163) and normal tissues (n=207) with error bars. The red boxes represent tumor samples and the blue ones represent normal samples. *, p-value≤0.05. (C) The violin figures represent the expression level of crucial genes in both wild type and IDH1 mutated samples. (D) Integrated view of clinical data and gene aberration in GBM patients (370 samples). From top to bottom panels indicate: mutation spectrum, diagnosis age, sex, overall survival (months), tissue source site and mutation symbol of genes. The key to the color-coding is at the bottom.