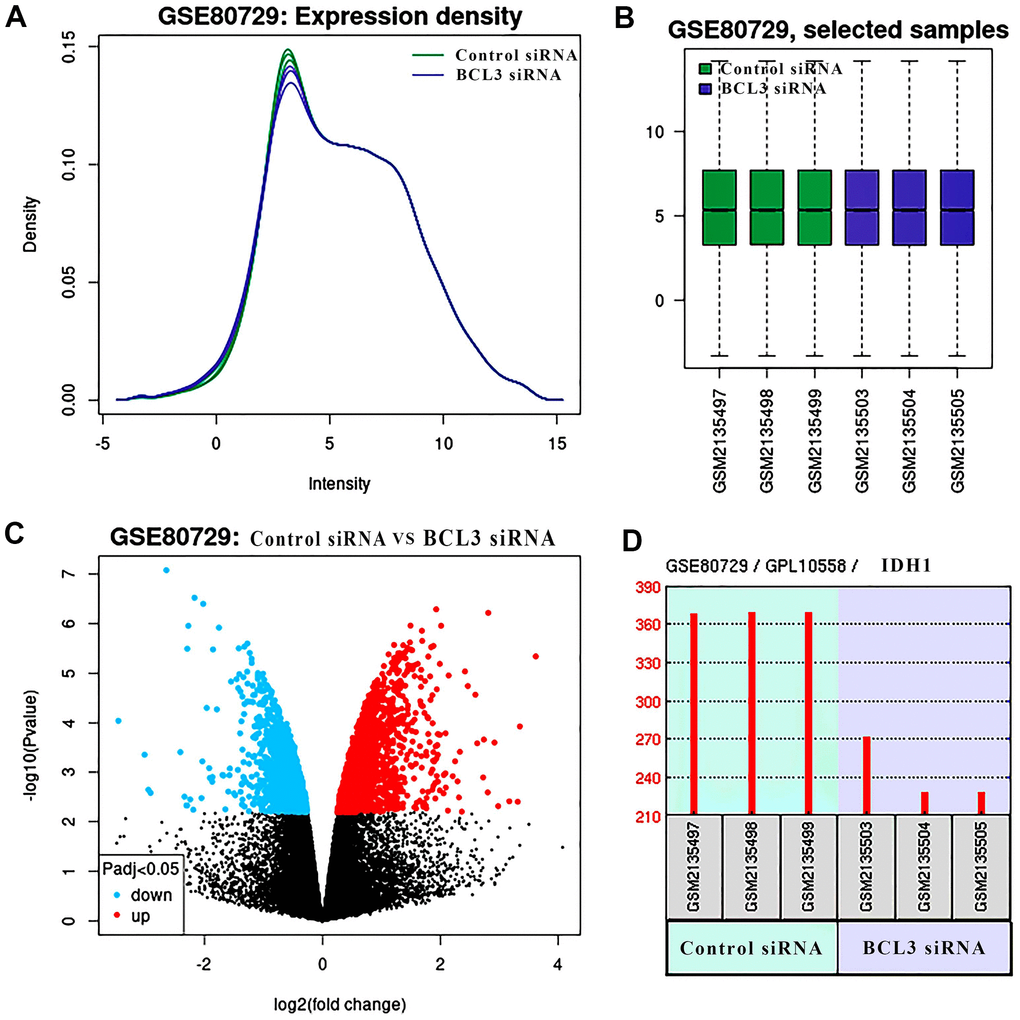
Figure 7.The DEGs in glioma treat with BCL3 siRNA. (A) The expression density of each sample. (B) The box plot shows the distribution of raw read counts. (C) The volcano plots show all DEGs of GSE80729 databases. The red points represent up-regulated genes while the blue ones represent down-regulated genes. The black points represent genes with no significant difference. (D) The expression of IDH1 in control and BCL3-siRNA group, each group has 3 replicate samples.