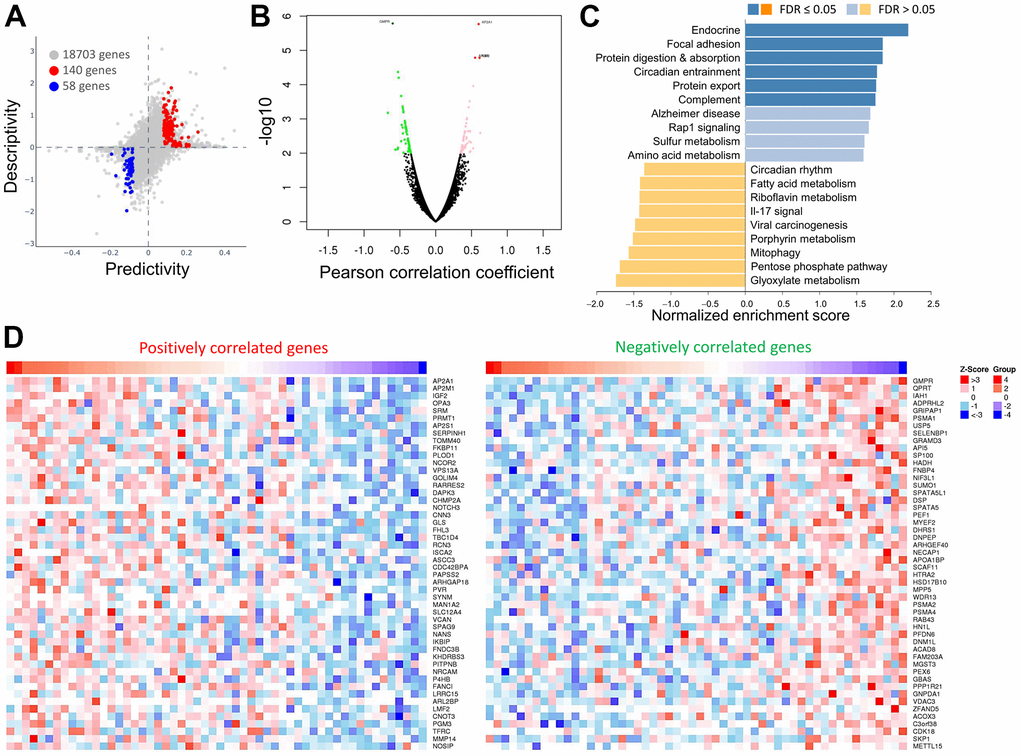
Figure 5.Comparisons and enrichment analysis of gene expression profiles in OPA3 in OV. (A) The predictability and descriptiveness between mRNA expression functions are plotted with ovarian cancer cell lines. (B) Analysis of differential gene expression associated with OPA3 in OV. (C) Functional enrichment analysis of OPA3 in OV. (D) Heatmap showing the top 50 genes are each significantly positively and negatively correlated with OPA3.