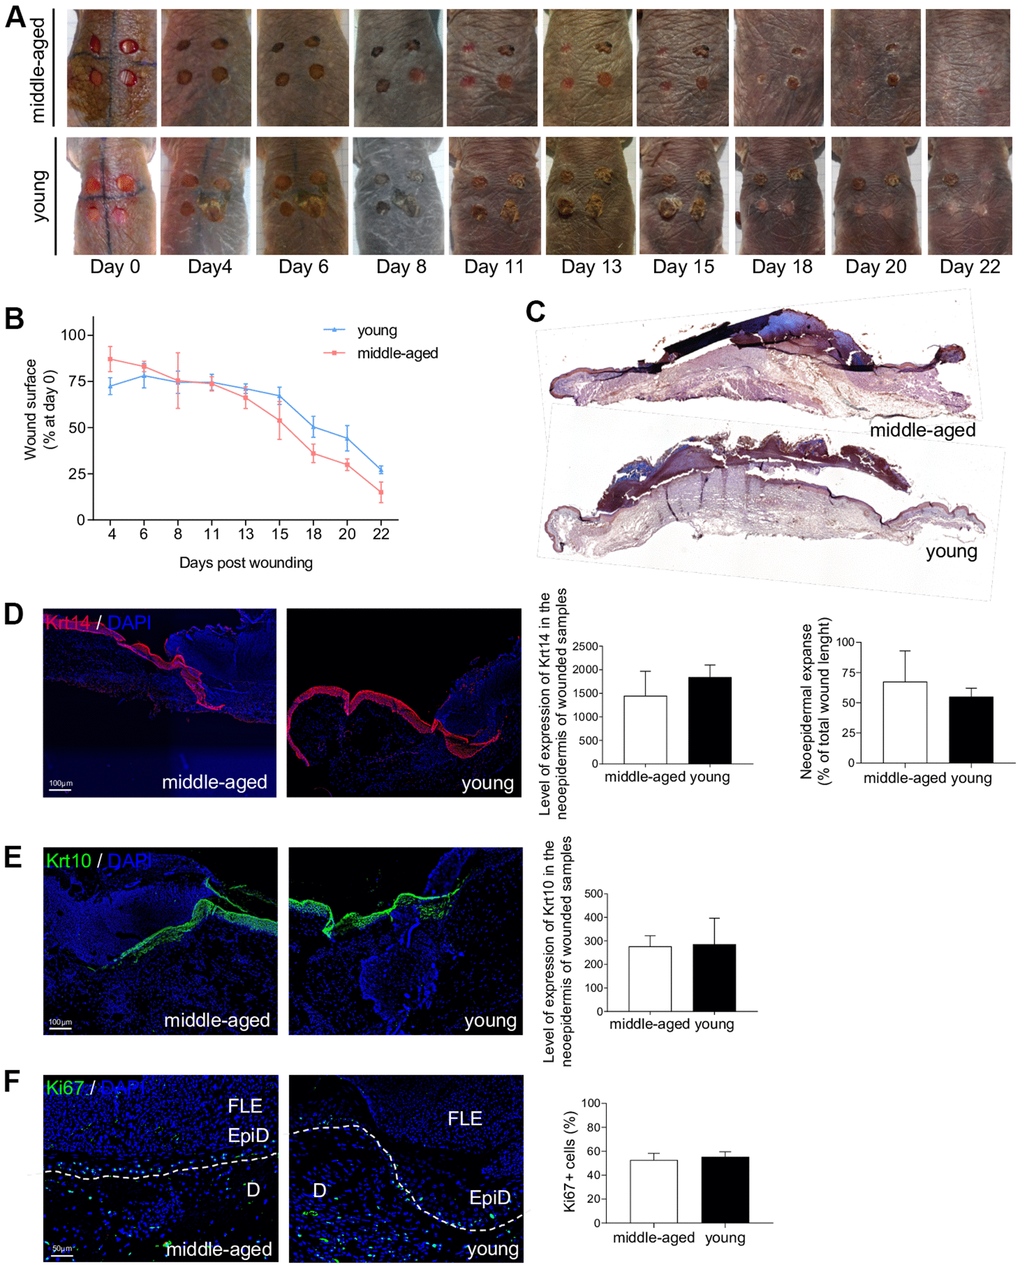
Figure 6.NMR wound healing. (A) Photomicrographs of back skin wounds for middle-aged and young animals from day 0 to day 22 post wounding. (B) Wound closure rate (% of wound surface at day 0) from day 4 to day 22 post wounding. No statistical difference was found the 2 groups using Student’s t-test. n=4 animals per group. (C) HE staining photomicrographs on sections of middle-aged and young NMR back skin 7 days post wounding. (D, E) Krt14 and Krt10 staining photomicrographs on sections of middle-aged and young NMR neoepidermal tongues in the wound at day 7. Histograms show the level of expression of Keratin-14 and Keratin-10 in the neoepidermis of wounded samples (mean grey value per field) and the percentage of re-epithelialization was calculated according to the formula: [length of the extending epidermal tongues]/[length of the wound] x100%. (F) Ki67 staining photomicrographs on sections of middle-aged and young NMR neoepidermal tongues in the wound at day 7. Histogram show the percentage of Ki67+ cells in epidermal wound edges representing the growth fraction of an epidermal tongue cell population. Legends: epidermal wound edges (EpiD), dermis (D), fibrino-leukocyte exudate (FLE). In (D–F), cells were stained with either Alexa 546 or Alexa 488 fluorochromes. Negative controls were performed in parallel with the samples substituting the primary antibody with the equivalent isotype. Scale bar = 50 or 100 μm. Dash lines represent the limit between epidermis and dermis. Bars: SEM. Student’s t-test were used. n=2 animals per group.