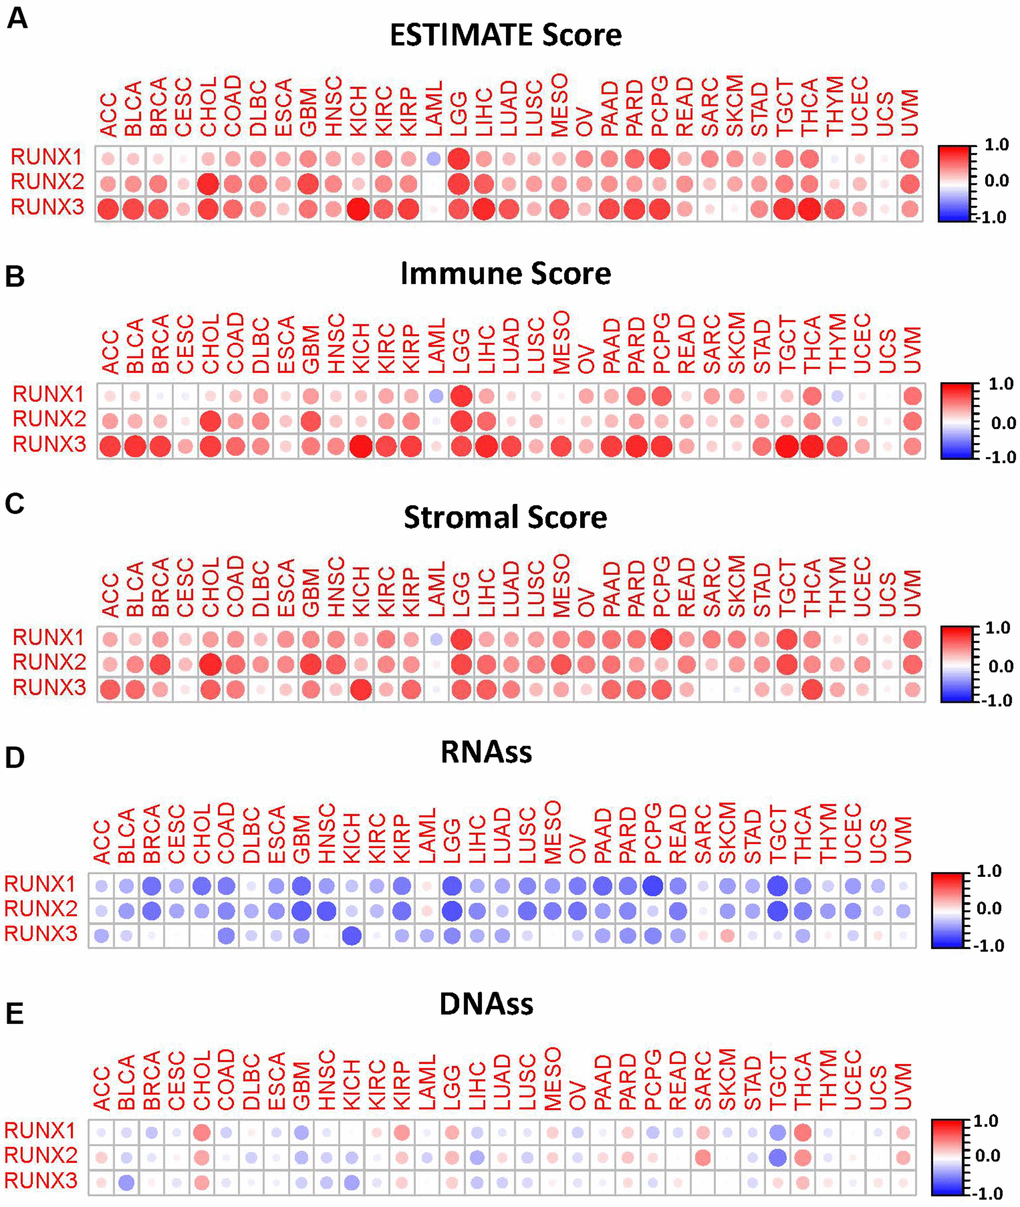
Figure 8.Correlation matrix plots of RUNX gene family gene expression with tumor microenvironment and stemness scores in 33 different cancer types. (A–C) RUNX gene family gene expression was associated with ESTIMATE, immune, and stromal scores in different cancers. (D, E) RUNX gene family gene expression was associated with RNAss and DNAss in different cancers. Spearman’s correlation was used for testing. Red dots indicate a positive correlation between gene expression and immune/stromal score, and blue dots indicate a negative correlation. The size of each dot represents the absolute value of the correlation coefficient.