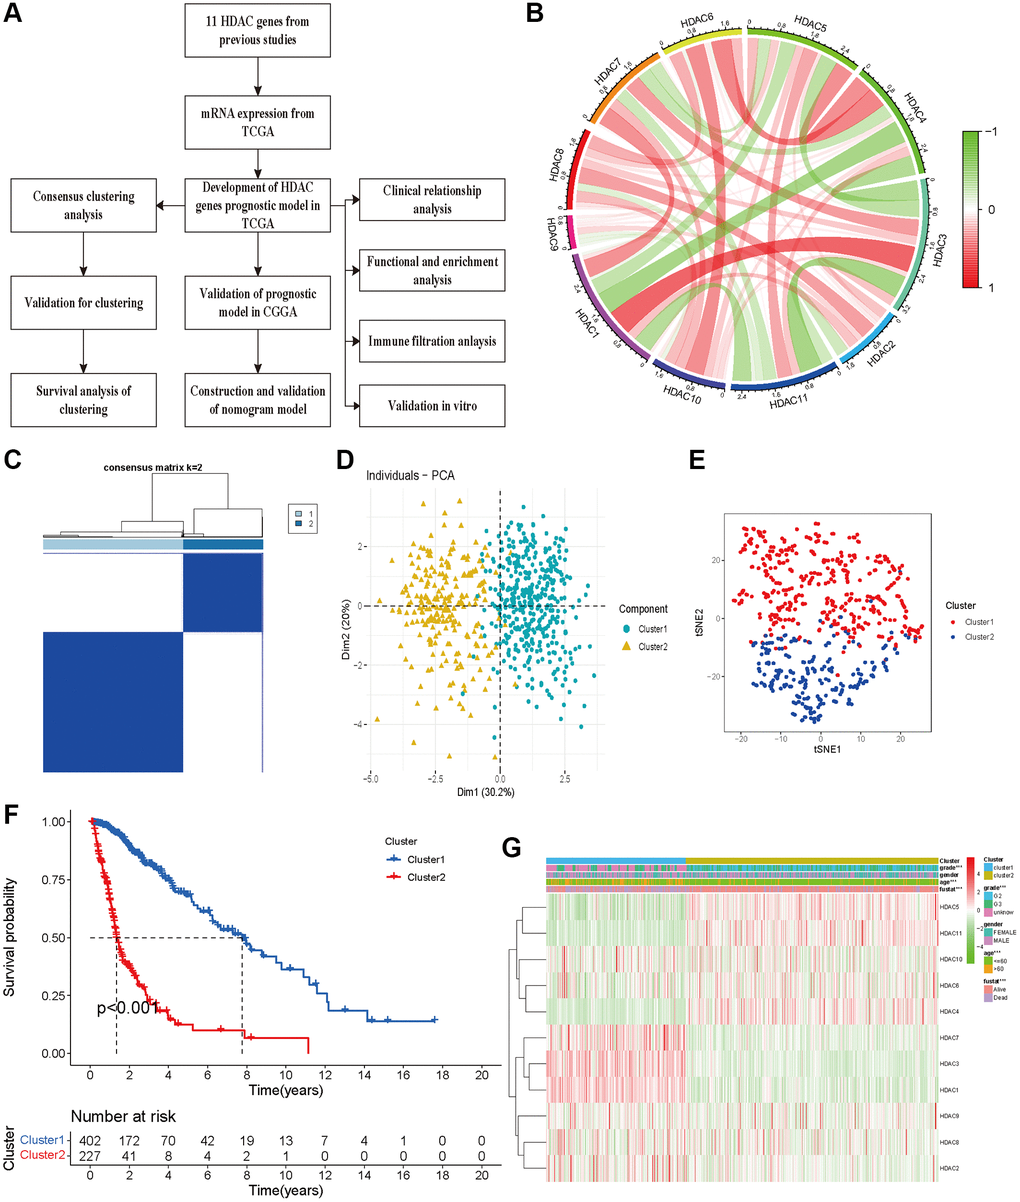
Figure 1.Glioma patients can be separated into two subclasses using HDAC genes. (A) The flow chart of data analysis. (B) The correlation circle plot among eleven HDAC genes. (C) The consensus matrix plot identified the best grouping (k = 2). (D) Principal component analysis of glioma subclasses in the TCGA dataset. (E) The corrected t-SNE2 analysis for two subclasses. (F) The Kaplan-Meier survival curve for two subclasses in TCGA dataset. (G) The correlation of different clinical parameters and HDAC gens expressions with subclasses.