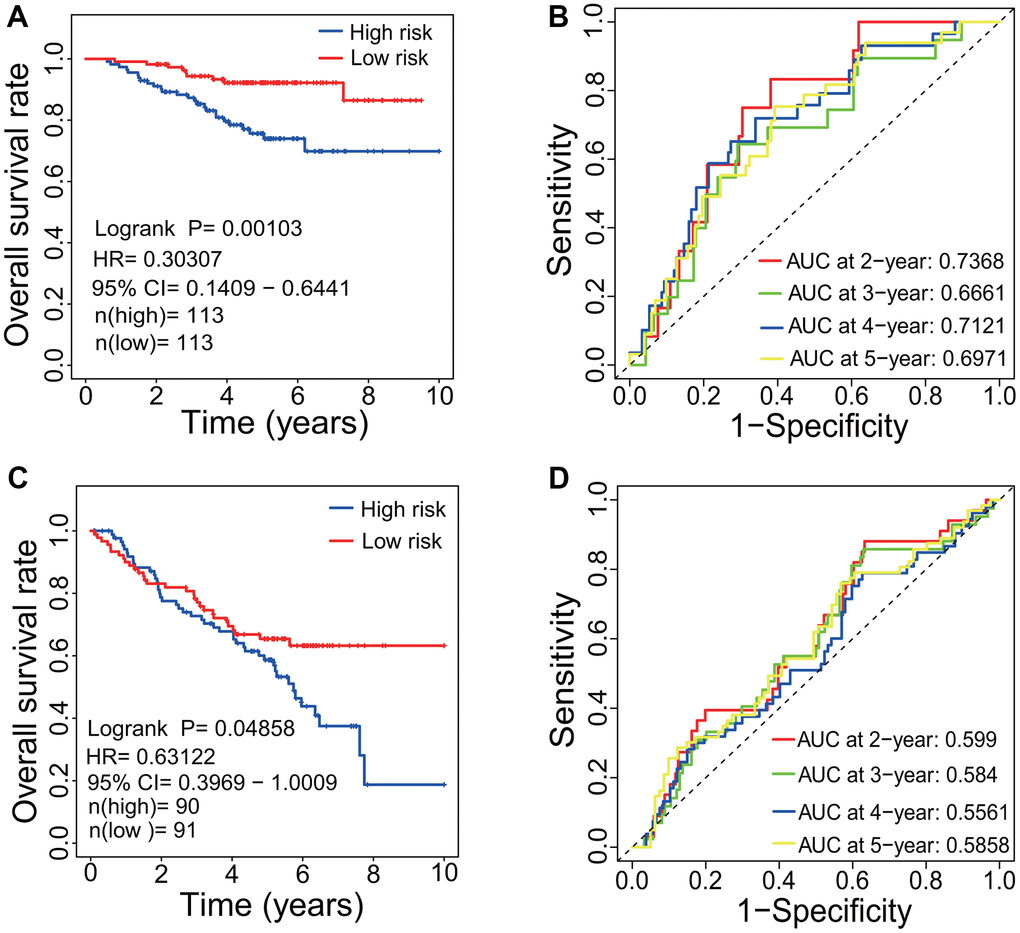
Figure 10.Evaluation of prognostic signature. (A) Survival curve based on GSE31210 dataset. LUAD patients in the low-risk group had a higher OS rate than that in the high-risk group (p=0.00103, HR=0.30307, 95% CI=0.1409-0.6441). (B) ROC curve based on GSE31210 dataset. The AUCs of 2-, 3-, 4- and 5-year associated with the survival were separately 0.7386, 0.6661, 0.7121 and 0.6971. (C) Survival curve based on GSE50081 dataset. LUAD patients in the low-risk group had a higher OS rate than that in the high-risk group (p=0.04858, HR=0.63122, 95% CI=0.3969-1.0009). (D) ROC curve based on GSE50081 dataset. The AUCs of 2-, 3-, 4- and 5-year associated with the survival were separately 0.599, 0.584, 0.5561 and 0.5858. LUAD, lung adenocarcinoma; OS, overall survival; HR, hazard rate; ROC, receiver operating characteristic; AUC, area under the curve; CI, confidence interval.