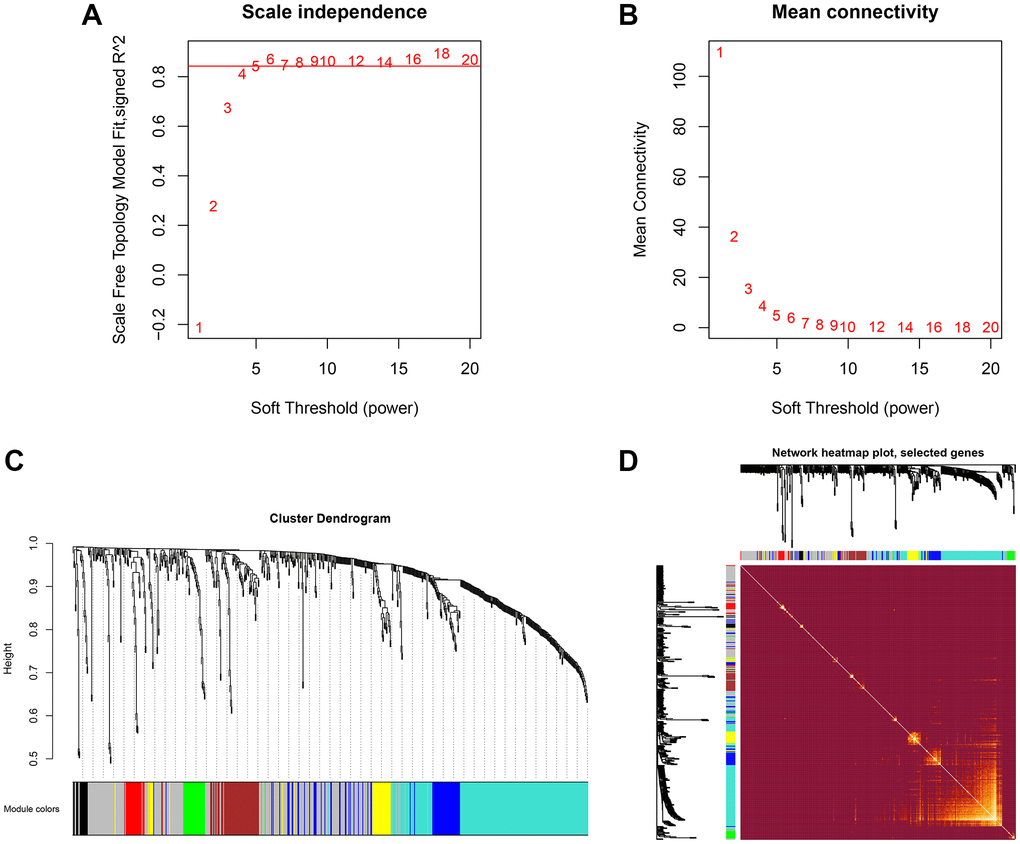
Figure 1.Hierarchical clustering and co-expressed modules identified by WGCNA. (A, B) the scale-free network, was created with the scale-free R2 = 0.8 and soft threshold = 10 to obtain the best-fit topology model. (C) 10 modules were identified based on the hierarchical clustering dendrogram of proteins. (D) The topological overlap map (TOM) for distinctive modules.