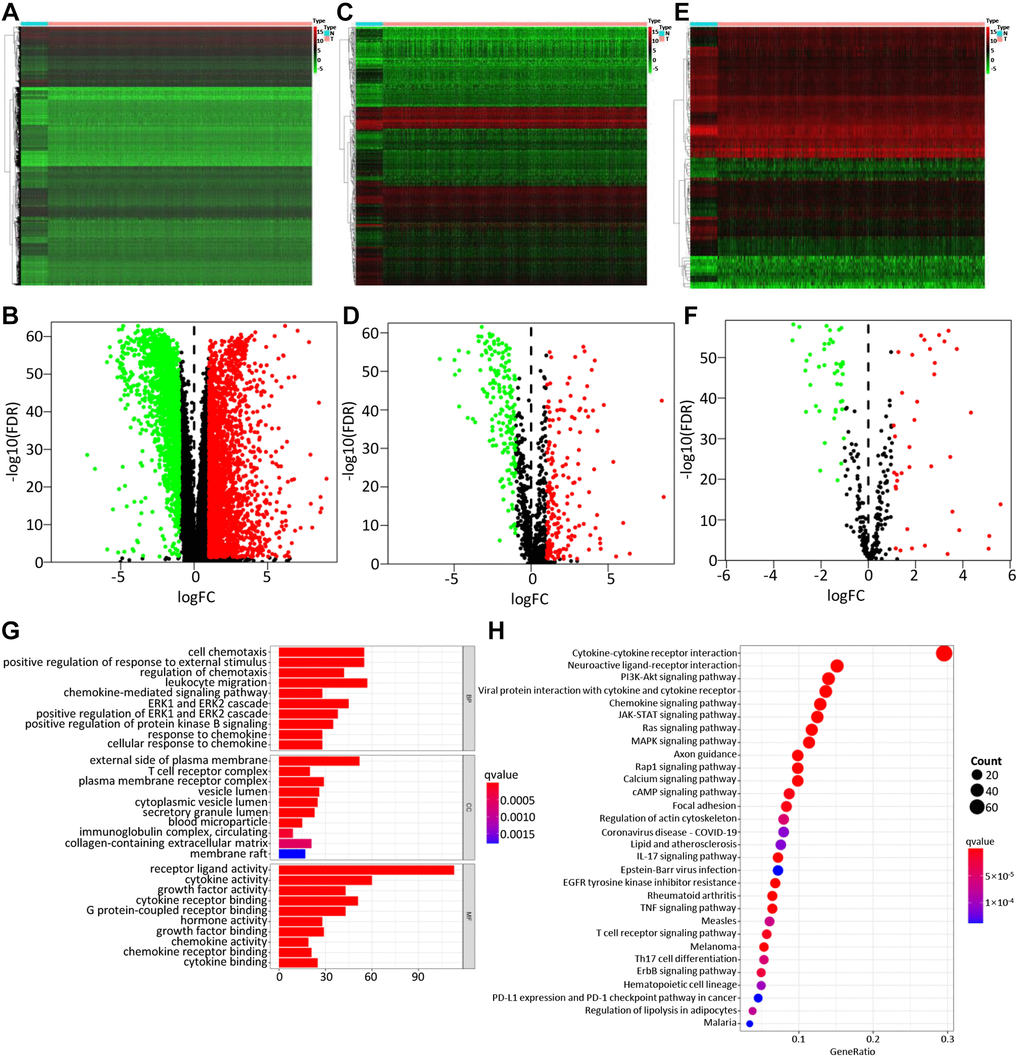
Figure 2.Differentially expressed genes, immune-related genes, and TFs. The differentially expressed genes between BC and non-tumor tissues were shown in the heatmap (A) and the volcano plot (B). Heatmap (C) and the volcano plot (D) indicated the differentially expressed immune-related genes (IRGs). Heatmap (E) and volcano plot (F) referred to the differential TFs between breast cancer and non-tumor tissues. Red dots represented the upregulated genes or TFs, green dots represent downregulated genes or TFs, and black dots represented not differentially expressed genes or TFs. N, normal tissue. T, tumor. The GO (G) and KEGG (H) functional enrichment analysis of immune-related genes (IRGs).