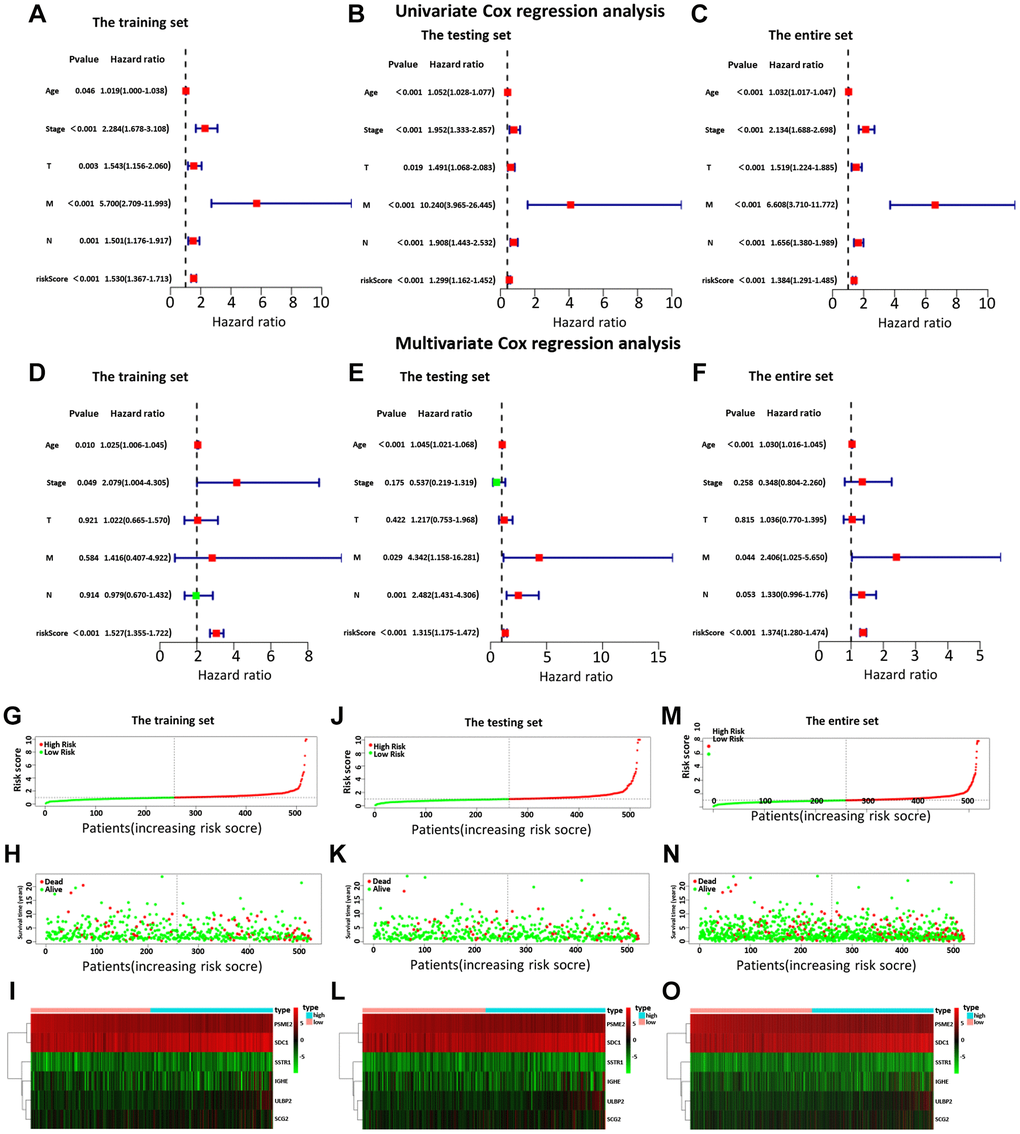
Figure 4.The univariate (A–C) and multiple (D–F) regression analysis of BC, including the relationships of the age, stage, T stage, distant metastasis, lymph node metastasis, and riskScore in the three sets. The training set (A, D), the testing set (B, E), and the entire set (C, F). The green squares indicated that the median value of hazard ratio (HR) was less than 1, while the red squares indicated that the median value of HR was greater than 1. Analysis of risk score, OS, and the expression of the six genes in the training set (G–I), testing set (J–L), and entire set (M–O). The risk score, OS, and heat map were listed from top to bottom.