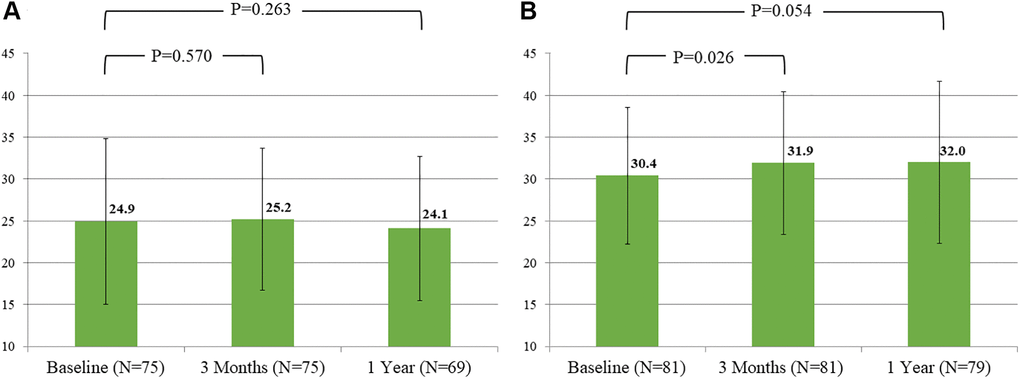
Figure 4.Evolution of mean score of verbal fluency over time by groups. (A) Intermediate-high risk group. (B) Low risk group.
Figure 4 — Serial neurocognitive changes following transcatheter aortic valve replacement: comparison between low and intermediate-high risk groups | Aging